
Data for 2025
Acknowledgements
Engineers Canada would like to thank and recognize the contributions of several staff who helped make this report possible including: Katharine Burke, Vivian Qian, Laura Paul, P.Eng., Kim Bouffard, Shelley Ford, and Jeanette Southwood, P.Eng. We would also like to thank Lili El-Tawil, for the French translation of this report, and Matthew Kulka for his work on the presentation of this report.
1. Summary
Engineers Canada’s annual National Membership Report collects information from the provincial and territorial engineering regulators about their membership in order to paint a picture of the engineering profession in Canada. The 2026 report captures data from January 1, 2025, to December 31, 2025. Engineering members are categorized based on the definition of practice in each jurisdiction. Please find here all data tables associated with this report.
Overall, there was a moderate increase in licensing (1.3 per cent) and membership in 2025 from the previous year.
Sex identifiers have historically been limited to “male” and “female” in the survey of national membership and in the surveys by many of our provincial and territorial regulators of their membership. We use “female-identifying” to describe participants who selected female, and “male-identifying” to describe participants who selected male, to be as literal as possible, to limit the assumptions between sex and gender identifiers, and to acknowledge the gender diversity that exists within these sex identities.
Note also that when surveying members about their sex and/or gender identifiers, respondents have the option to select “prefer not to say.” Therefore, throughout this report, when calculating the percentages of female-identifying and male-identifying engineers in the profession, this calculation excludes those individuals who responded ‘rather not say’ from calculation as we have no indication of their gender or sex identity.
It should also be noted that each regulator collects and stores membership data according to their internal policies, which may vary nationally.
2. Growth in the engineering profession
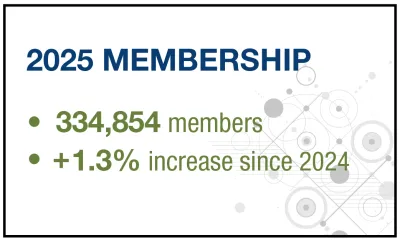
Membership in the provincial and territorial regulators increased moderately from 2024 to 2025. There were 334,854 members[1] as of December 31, 2025, across the 12 engineering regulators comprising the national total membership (see Table 1). This is an increase of 4,215 members.[2] In 2025, the largest growth in numbers was seen in British Columbia (1,410 more members), and the greatest decline was seen in Ontario (1,197 fewer members).
3. Newly licensed engineers
To understand the future of the profession, we track the number of newly licensed engineers[3] each year. There were 10,555 newly licensed engineers in 2025, with the largest number (4,307 engineers) obtaining their licence through Professional Engineers Ontario (PEO) (see Table 2).
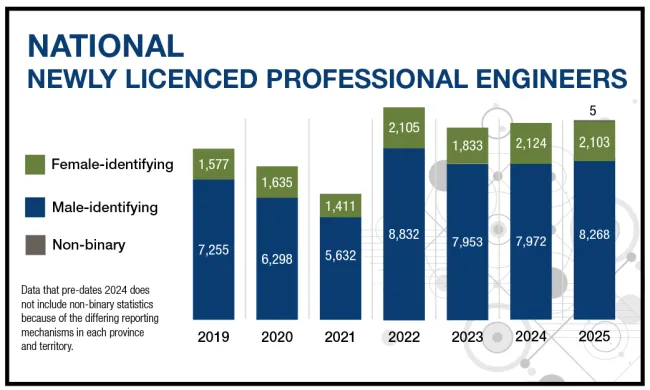
For the ten-year trend in newly licensed engineers (2014 to 2024) see Table 3.
Further analysis of the pathway to licensure is captured in the section, ‘Sex representation in engineering.’
4. Engineers-in-training
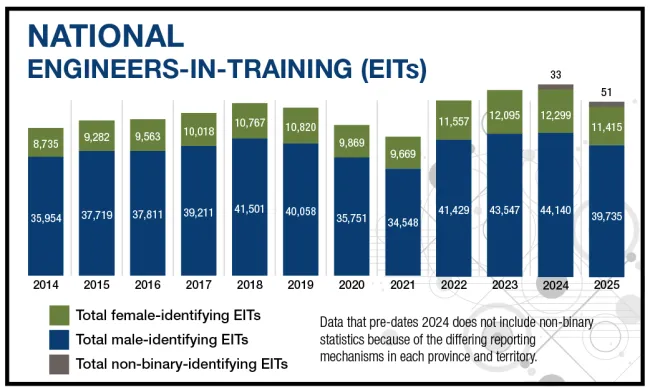
The number of engineers-in-training (EITs) decreased between 2024 and 2025, by 4,381 members. This decrease is driven primarily by a reduction in Ontario’s EIT population following changes to PEO's EIT program, which had a significant impact on the national total. The numbers of male- and female-identifying EITs decreased, while the number of non-binary EITs increased.
See Table 4 for the national EIT data from 2014 to 2025.
Further analysis of female-identifying EIT’s is captured in the section, ‘Sex representation in engineering.’
5. Sex representation in engineering
Note: When surveying members about their sex and/or gender identifiers, respondents have the option to select “prefer not to say.” Therefore, throughout this report, when calculating the percentages of female-identifying, male-identifying, and non-binary-identifying engineers in the profession, this calculation excludes those individuals who responded ‘rather not say’ from calculation as we have no indication of their gender or sex identity.
There are 53,679 female-identifying engineering members, representing 16.3 per cent of total national membership in 2025 (an increase from 15.8 per cent in 2024).[4] This is an increase of 1,579 members who are female-identifying between 2024 and 2025. Nova Scotia achieved the largest increase, jumping 4.4 per cent (from 15.1 to 19.5).
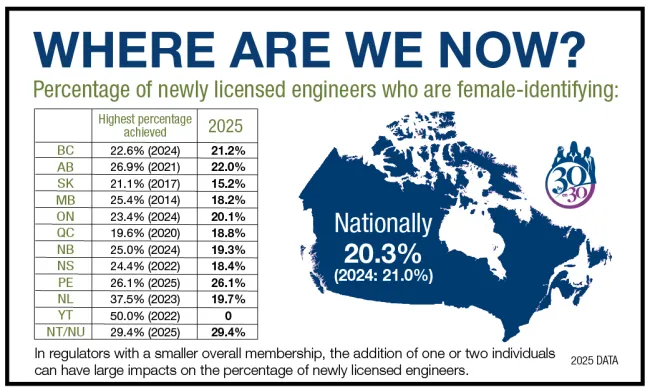
Engineers Canada and the regulators have been tracking the number of newly licensed female-identifying engineers since 2014, as part of the 30 by 30 initiative. In 2015, Engineers Canada launched the 30 by 30 initiative with support from the provincial and territorial regulators. 30 by 30 is a commitment to increasing the proportion of newly licensed engineers who are women to 30 per cent by 2030.
This is an important metric for tracking the impact of programs that support gender equity in engineering, since it marks a career milestone for women in their early careers, post-graduation from an accredited program, or for internationally trained engineers entering the Canadian job market.
Year over year, more female-identifying individuals are entering the profession. The total number of female-identifying individuals obtaining their licence in 2025 decreased slightly by 21 engineers from the previous year. At the same time, more male-identifying engineers are also joining the profession, with the proportion of female-identifying engineers accounting for 20.3 per cent of newly licensed engineers in Canada in 2025 (see Table 2), which is a slight decrease from 21.0 per cent in 2024.
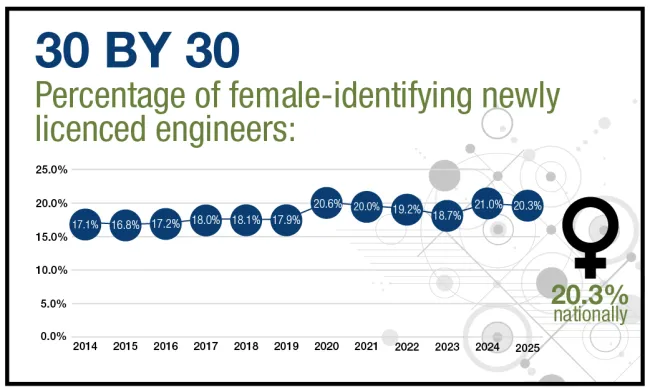
The largest increase, by region, of newly licensed female-identifying engineers between 2024 and 2025 occurred in Prince Edward Island (increasing by 8.8 per cent).
The number of female-identifying EITs increased in 2025 by 884 members, with the overall proportion slightly increasing to 22.2 per cent in 2025 from 21.8 per cent in 2024. See Table 4 for the full breakdown of male-, female-, and non-binary-identifying EITs.
Engineering student membership saw a decrease in female-identifying members. The representation of engineering student members who identify as female decreased slightly to 24.4 per cent from 25.0 per cent between 2024 and 2025.
More data and information about gender representation at Canadian Engineering Accreditation Board (CEAB)-accredited engineering programs can be found in Engineers Canada’s Enrolment and Degrees Awarded Report.
Endnotes
[1] The category, Members, includes Practising P.Eng.’s (exclusive), Temporary License Holders, License to Practise Holders, Restricted License Holders, Non-Practising P.Eng.’s, Life Members and Engineers-in-Training. It does not include students.
[2] Engineers Canada, 2024. “2024 National Membership Information.” Engineers Canada, Ottawa, Canada. Available: https://engineerscanada.ca/reports/national-membership-report/2024-national-membership-information
[3] The category, Newly Licensed, includes individuals licensed as Professional Engineers for the first time that are Canadian Engineering Accreditation Board trained, Internationally trained, or have obtained their license by some other route. It does not include interprovincial mobility applicants.
[4] Sex and gender definition: Sex identifiers have historically been limited to ‘male’ and ‘female’ in the survey of national membership. We use “female-identifying” to describe participants who selected female, and “male-identifying” to describe participants who selected male, be as literal as possible, to limit the assumptions between sex and gender identifiers, and to acknowledge the gender diversity that exists within these sex identities.