Data for 2016
This page provides annual information on the provincial and territorial engineering regulators’ membership in order to deliver timely and accurate information about the engineering profession in Canada. Please find all data tables associated with the report below here.
NOTE 1: Professional Engineers of Ontario (PEO) changed how it reports membership information in 2016. This has caused incongruent membership reporting, particularly from 2015 to 2016. For the purposes of this report, when completing year-to-year comparisons, the numbers stated exclude PEO, leaving the remaining eleven regulators.
NOTE 2: The original posting of this report included an error in the number of newly licensed engineers who are women. The information presented here has been updated accordingly.
Growth in the engineering profession
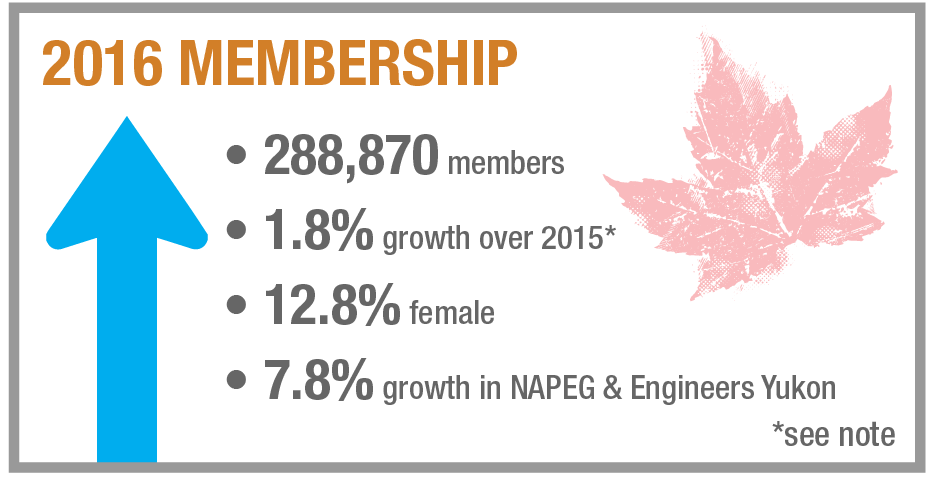
Membership in the provincial and territorial regulators grew again in 2016. In total, as of December 31, 2016, there were 288,870 members (excluding students) [i] of the twelve engineering regulators (see Table 1). Of the 2016 membership, 12.8 per cent were female. Excluding PEO (see Note 1 above), total membership of the remaining eleven regulators increased by 1.8 per cent, female membership increased 4.5 per cent, and male membership increased 1.4 per cent.
Since 2015, the territorial regulators have seen the greatest growth in membership, with 7.8 per cent growth in the Northwest Territories and Nunavut (NAPEG) and the Yukon (APEY). While female members increased nationally by 4.5 per cent (excluding PEO), the largest gains were found in the territories, with a 25.7 per cent increase in Yukon, and a 16.3 per cent increase in the Northwest Territories and Nunavut.
There were 168,072 practising professional engineers licensed in the jurisdiction where they reside. Of these, 13.7 per cent were women (see Table 2). There were 8,618 newly licensed engineers in 2016. The number of newly licensed engineers has decreased nationally since 2015, whether including (12.1 per cent) or excluding PEO (5.8 per cent).
30 by 30
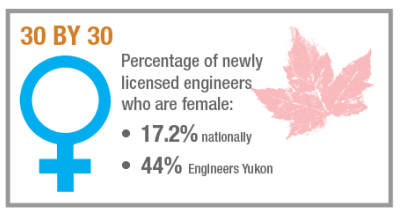
In 2015, Engineers Canada launched 30 by 30 with the support of numerous provincial and territorial stakeholders. 30 by 30 is a commitment to increasing the number of newly licensed engineers who are women to 30 per cent by 2030. Nationally, 17.2 per cent of newly licensed engineers were women in 2016 (see Table 3), up from 16.8 per cent in 2015. Engineers Yukon had the highest proportion of newly licensed engineers who were women at 44 per cent. APEGA and Engineers Nova Scotia both reported more than 18 per cent of newly licensed engineers as female (18.7 per cent and 18.5 per cent, respectively).
Residency of engineers
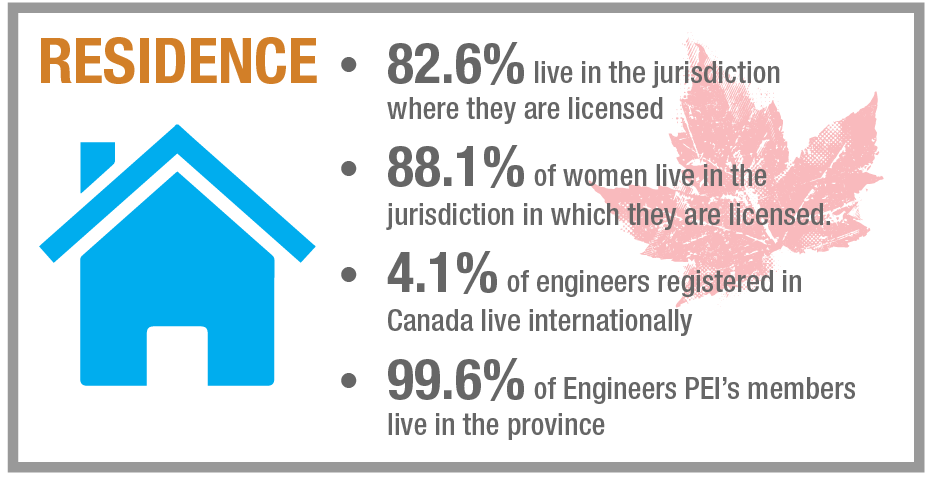
Nationally, 82.6 per cent of engineers reside in the jurisdiction where they work, consistent with previous years. Engineers PEI had the highest percentage of its engineers residing in the province (99.6 per cent), while Engineers Yukon had the lowest (17.2 per cent). Nationally, 13.3 per cent of practising engineers hold licences in provinces or territories other than where they principally reside. The remaining 4.1 per cent of engineers registered in Canada live abroad. Engineers who are women are more likely to reside in the jurisdiction where they practice (Table 2, above).
Engineers per 1,000 people
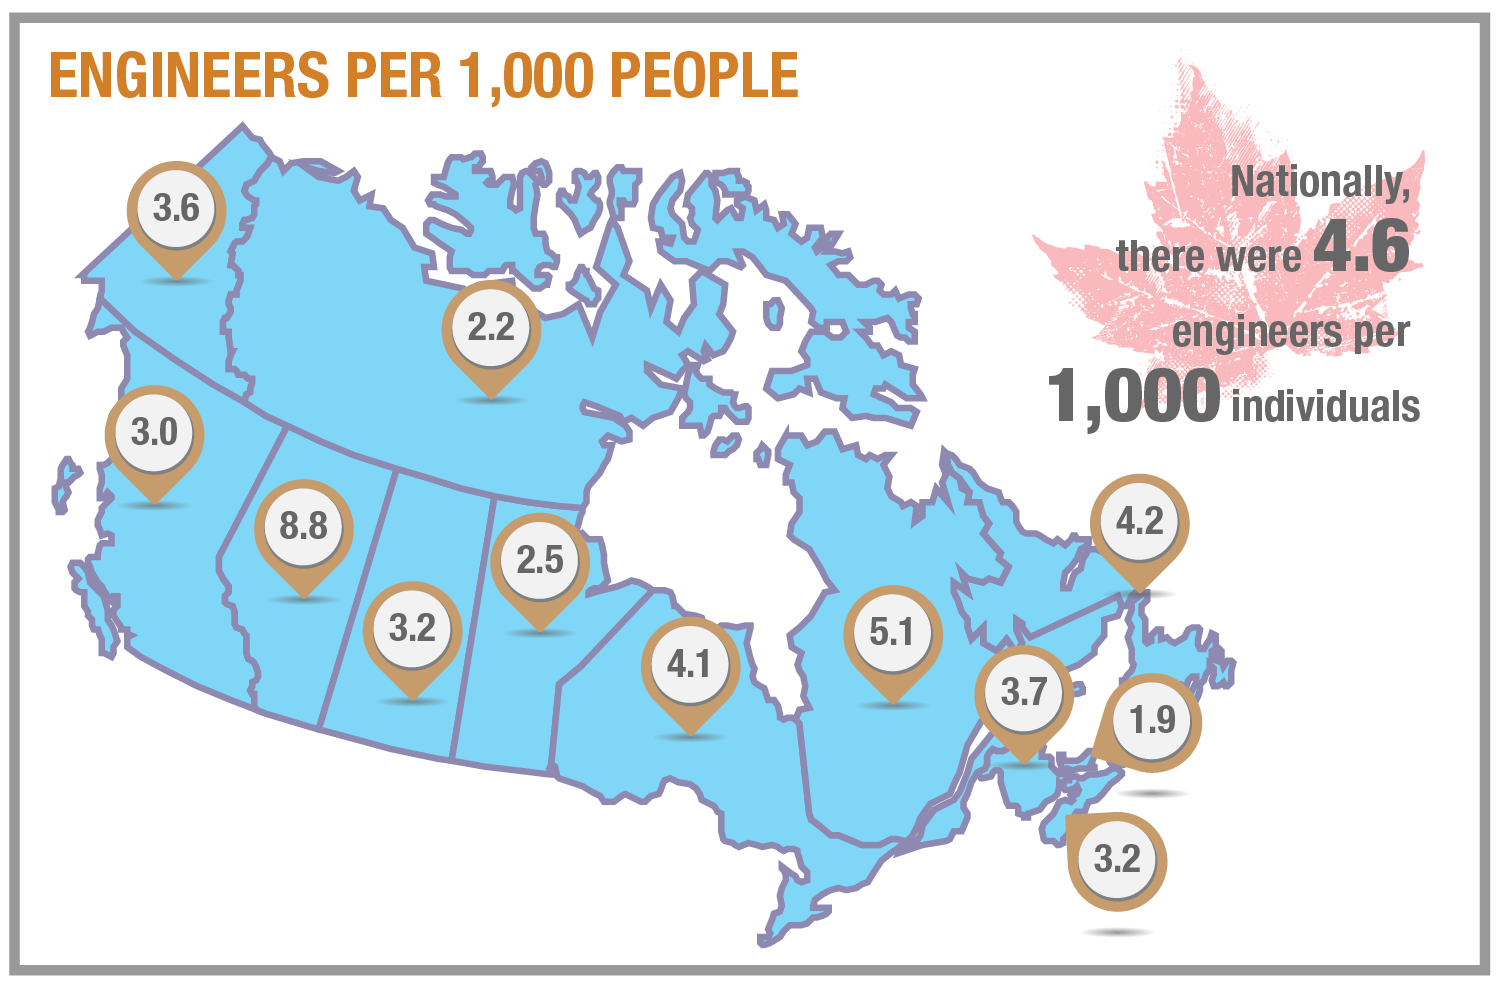
In 2016, the number of engineers that are residents in the jurisdiction where they are licensed per one-thousand people [ii] ranged from about two engineers per one-thousand in PEI, to nearly nine engineers per one-thousand in Alberta. Nationally, there were 4.6 engineers per 1,000 individuals (see Table 4).
From engineering student to professional engineer
In 2012, there were 12,382 graduates from accredited post-secondary engineering programs. In 2016, there were 5,982 graduates from accredited programs who obtained their engineering licence. Working under the assumption that it takes approximately four years for a graduate from an accredited engineering program to obtain their professional engineering license, approximately 48.3 per cent of the 2012 cohort proceeded along the path to licensure and became licensed in 2016. Although this is an estimation, it is an attempt at measuring the successful continuation of engineering students along the path to licensure.
How do I obtain a copy of previous reports?
- Read the 2015 report.
- Read the 2014 report.
- Read the 2013 report.
For more information contact us at research@engineerscanada.ca