Analysis of secondary data to support Engineers Canada’s Operational Imperative 9 sub-strategy: Indigenous access to engineering
1.0 Executive summary
In 2019, as part of Engineers Canada’s work on equity, diversity and inclusion, Engineers Canada approved the Operational imperative 9 sub-strategy on Indigenous access to engineering. This sub-strategy includes a goal of collecting data on Indigenous engineering students and professionals in Canada. To meet this goal, Engineers Canada has worked with Big River Analytics to identify and analyze secondary data to estimate the number of Indigenous engineers. This report summarizes this data and estimates related to the participation of Indigenous engineers in the profession. Engineers Canada and Engineers Canada’s Indigenous Advisory Committee see better understanding Indigenous representation as a foundational step to identifying and building supports for Indigenous people in engineering.
The key metric presented in this report is the proportion of all engineers that identify as Indigenous, as defined by National Occupation Classification (NOC) codes (see Section 2.1 and 3.1). As a measure of diversity, equity, and inclusion, this metric is compared to two benchmarks: the proportion of Indigenous people in the labour force in their main working years (aged 25 - 64), and the proportion of all Canadians that identify as Indigenous. To better estimate the number of professional engineers, where possible, we report estimates of individuals with engineering NOCs and an education level at a bachelor or above. This report also compares demographics, educational attainment, geographic location, and income between Indigenous and non-Indigenous engineers. The main findings of our analysis are:
- Indigenous people are underrepresented in engineering occupations relative to Indigenous representation in the total population and in the labour force. This finding holds at both the national and provincial level.
- Considering only those individuals in their main working years with an education at the bachelor level or above, the percentage of all engineers that identify as Indigenous is 0.73 per cent. The percentage of the labour force in their main working years that identify as Indigenous is 3.15 per cent. By this metric, for the engineering profession to include a representative number of Indigenous people, an additional 5,620 Indigenous engineers are required.
- The percentage of the total population in Canada that identify as Indigenous is 4.9 per cent. If we consider Indigenous representation in the total population as our benchmark, for the engineering profession to include a representative number of Indigenous people, an additional 9,678 Indigenous engineers are required.
- The largest within-province gaps are in Nunavut, Northwest Territories, Yukon, Manitoba, and Saskatchewan.
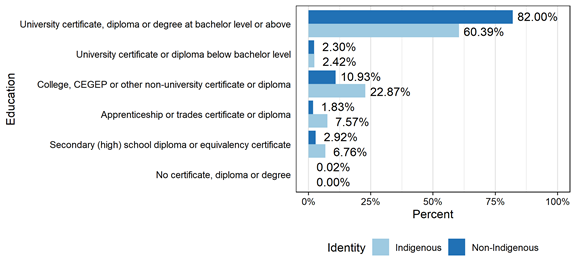
- The lack of Indigenous representation identified in our analysis likely understates the actual underrepresentation among professional engineers. Only 60.39 per cent of Indigenous engineers have a university education at a bachelor level or above, compared to 82.00 per cent of non-Indigenous engineers. A university education at a bachelor level or above is generally required to be certified by the engineering regulators.
- The regional distribution of Indigenous engineers reflects the distribution of the total Indigenous population in Canada. Provinces with a higher Indigenous population also have a higher count of Indigenous engineers. Representation among Indigenous engineers is highest in Ontario, Alberta, Quebec, and British Columbia.
The initial analysis in this report estimates the gap in representation between Indigenous and non-Indigenous individuals in engineering occupations. Existing secondary data is not able to identify which individuals in engineering occupations are professional engineers as licensed by regulators. Section 4.0 highlights recommendations for additional research to refine and expand Engineers Canada's understanding of access to engineering among Indigenous people.
2.0 Background
Since the Truth and Reconciliation Commission of Canada (TRC) released its 94 Calls to Action in 2015, various initiatives were put into place by different levels of government and organizations to begin the process of reconciliation (Yellowhead Institute, 2019)1. The Calls to Action encourage Canadians to learn about and understand the history of Indigenous peoples in Canada and to engage in the process of reconciliation. In the context of employment and the labour force, Calls to Action 7 and 92 seek to eliminate employment gaps between Indigenous and non-Indigenous Canadians, ensure Indigenous people have equal access to jobs and training, and encourage corporations to adopt reconciliation frameworks throughout their policies and practices. These Calls to Action support strategies of inclusion and diversity in the workplace and are reflected in Engineers Canada’s efforts to achieve an engineering workforce that “reflects the demographics of Canadian society and continues to meet the needs of the Canadian economy” (About Diversity in Engineering, 2020).
Engineers Canada consulted with engineering regulators and Indigenous engineers to create the Operational Imperative 9 sub-strategy: Indigenous access to engineering. The sub-strategy includes the following goals:
- Engineers Canada supports engagement with Indigenous histories, increasing awareness and cultural competency?.
- Engineers Canada supports Indigenous engineers and engineering students.
- Engineers Canada explores collection of data on Indigenous students and professionals.
- Engineers Canada develops a framework for engaging with Indigenous organizations?.
To achieve these goals, Engineers Canada receives guidance from its Indigenous Advisory Committee, and works in collaboration with the engineering regulators, and post-secondary engineering programs to share knowledge on Indigenizing engineering education and occupational environments. Examples of these measures include supporting the creation of the Canadian Indigenous Advisory Council,2 publishing a report on Indigenous students’ access to post-secondary engineering programs, and forming a Decolonizing and Indigenizing Engineering Education Network that addresses access to engineering education for Indigenous people. These measures have the objective of supporting and advancing reconciliation within engineering education programs (Indigenous Peoples in Engineering, 2020).
Engineers Canada has partnered with Big River Analytics to better understand Indigenous representation in engineering by answering several research questions that provide a foundational understanding of Indigenous engineers in the workforce. These research questions include:
- Which National Occupational Classifications (NOC) best correspond to the professional engineers of the 12 regulators?
- How many Indigenous engineers are there in Canada?
- What other socio-demographic and labour market characteristics can we understand from secondary data about Indigenous engineers?
- What can we infer about the diversity of professional engineers across the 12 regulators?
- Which other variables related to the diversity of professional engineers in Canada are readily available from secondary sources (e.g. sex/gender, visible minority, recent immigrants etc.)?
Although conditions have generally been improving over the past several decades, the 2016 Census of the Population (2016 Census) shows that many socioeconomic gaps between the Indigenous and non-Indigenous population persist. For example, 52.07 per cent of the Indigenous population are employed compared to 60.51 per cent of the non-Indigenous population and the Indigenous unemployment rate (15.22 per cent) is twice as high as the non-Indigenous unemployment rate (7.41 per cent). Additionally, there are differences in the concentration of Indigenous and non-Indigenous employment in various occupations. According to a study conducted by Statistics Canada (2017) using data from the Labour Force Survey (LFS), “Aboriginal3 people were less likely than non?Aboriginal people to work in natural and applied sciences and related occupations; business, finance and administration occupations; management occupations; and health occupations. The only group of knowledge occupations in which Aboriginal people are overrepresented is education, law and social, community and government services” (Statistics Canada, 2017c).
Indigenous people tend to be underrepresented in occupations that require higher levels of education, and engineering is no exception. Access to education was one of the top three barriers to employment mentioned by respondents to the 2017 Aboriginal Peoples Survey (APS), a finding that is supported by findings from the 2016 Census, which shows that 21.37 per cent of the Indigenous workforce has less than a high school education compared to 10.31 per cent of the non-Indigenous workforce, and 11.67 per cent of the Indigenous workforce has a bachelor’s degree or higher compared to 28.52 per cent of the non-Indigenous workforce. There is good evidence to suggest that this gap in educational attainment is the result of the history of colonialism and oppression of Indigenous peoples in Canada, which has created inequalities in spaces such as education, healthcare, and the labour market (MacDonald & Steenbeek, 2015).
By examining the information available from the 2016 Census, Engineers Canada hopes to better understand the current state of diversity, equity, and inclusion of Indigenous people in the engineering profession. This report highlights differences between Indigenous and non-Indigenous engineers, such as their level of education and age distribution, and discusses various instances of the underrepresentation of Indigenous engineers compared to benchmarks of diversity. This report begins with an overview of secondary data sources, followed by a data analysis section and an examination of additional research questions, and concludes with recommendations for future primary data collection that would support a more detailed analysis of similar research topics.
2.1 Data sources
In general, data can be categorized as either primary or secondary. Primary data is defined as data collected first-hand for the expressed purpose of answering a specific research question. Secondary data is defined as data that was originally collected for a specific research purpose but is being used in a context outside of that original purpose. Secondary data is available from a variety of sources including government institutions like Statistics Canada, and other organizations like financial institutions and universities.
When using secondary data, it is important to understand the content of the data set, the data quality, the collection method(s), any weights applied to the data, and the advantages and limitations of the data as they apply to your research question. One advantage to using Statistics Canada data products, and most secondary data products, is that they are relatively inexpensive and easy to access. Statistics Canada offers publicly available data in the form of tables, custom tabulations, and anonymized data sets. Since using secondary data is significantly less costly than collecting primary data, it should be used to the extent that it serves the research project. For example, secondary data can be used to frame and better understand the context of a research landscape prior to embarking on a primary data collection exercise.
2.1.1 The National Occupational Classification system
In Statistics Canada’s products, occupations are categorized using the NOC system, which was developed and is maintained by Employment and Social Development Canada (ESDC). ESDC is responsible for organizing unique occupations into groups by skill level and type. NOCs are classified using a numerical code that can be up to four digits. The first number in the code series indicates skill type. Employment positions within engineering occupations fall under two skill types: group 0 for management roles and group 2 for occupations in natural and applied sciences. The second number in the NOC code series refers to the skill level. Both management and general engineering NOC codes are grouped under 0 or 1, indicating that they “usually require university education” (Employment and Social Development Canada, 2020). The third and fourth numbers in the NOC code specify the minor group and unit group of the specific occupation. As such, using NOCs allows for analysis among engineering specializations, such as civil, mechanical, software, petroleum, and several other engineering categories.
2.1.2 Assumptions when using NOCs to estimate engineers
Important for this report, NOCs do not provide information on who is a professional engineer, so we infer this information by filtering for both occupation type and education levels that align with those of a professional engineer.4 A detailed list of NOCs that align with the accredited engineering programs is provided in Section 3.1 and Table 3.1. When referencing individuals in engineering occupations we include anyone with an engineering NOC, listed in Section 3.1. To better estimate professional engineers, where possible, we identify individuals with engineering NOCs and an education level at a bachelor or above.
Although using NOCs limits our ability to identify professional engineers, it does still provide insights into access to the engineering field. Additionally, if we assume that a combination of NOCs and education are equally accurate in identifying Indigenous and non-Indigenous professional engineers, this limitation does not impact the accuracy of the gap measured between both groups. In other words, if we assume the same proportion of Indigenous and non-Indigenous individuals with a bachelor's level or higher education who are in the labour force in engineering NOCs are in fact professional engineers, comparing the respective rates of representation in each population would still accurately estimate a gap in representation.
2.1.3 The Census of the Population
In this report, we use the 2016 Census as a secondary data source to examine Indigenous inclusion in engineering. Despite being somewhat dated, the 2016 Census is the most appropriate secondary data source for this project as it is a detailed data set that yields preliminary answers to our research questions. Data from the 2016 Census come from two different questionnaires: the long-form and short-form. The long-form includes the same questions as the short-form with an additional set of questions that allow for a deeper understanding of respondents’ activities of daily living, sociocultural information, Indigenous identity,5 mobility, place of birth, education level, labour market activities, and housing situation. Because of the increased effort required to participate in, collect, and process the long-form census, it is delivered to a 25 per cent sample of Canadian households. In 2016, and likely for all future census enumerations, the short-form and long-form questionnaires were mandatory and had a combined response rate of 97.4 per cent. The combined response rate is calculated by dividing the number of private dwellings for which a census questionnaire was completed by the total number of estimated private dwellings in Canada. Among census enumerations, the 2016 Census had a particularly high response rate which allows for precise estimates that are less likely to suffer from non-response bias. Non-response bias occurs when certain groups of people respond more or less frequently to a survey than other groups of people and the aspects that define these groups are correlated with variables of interest. For example, suppose people with lower incomes responded less frequently to the long-form census than people with higher incomes. If we were interested in Canadian’s incomes, this biased sample would tend to overestimate the average income in the Canadian population.
For a subset of the information they collect such as date of birth, age, sex, relationship to members of their household, and knowledge of languages, the combined short- and long-form questionnaires are considered a true census in that they endeavor to enumerate the entire Canadian population. The long-form questionnaire enumerates a 1 in 4 (25 per cent) sample of the population. The long-form sample of the 2016 Census is designed to be representative of all Canadians and is enumerated by selecting participants based on an equal division of 46,000 small geographic areas called collection units (CUs) that span across Canada (Statistics Canada, 2017d). To increase the accuracy of the estimates that rely on information from the long-form census, responses are weighted to correct for any groups that might be over or under sampled. Another method that is used to increase estimate quality and correct for non-responses is imputation, which involves replacing missing, invalid, or inconsistent elements with plausible values and allows for the creation of a full dataset of information (Statistics Canada, 2017b). Imputation is directly related to the global non-response rate (GNR), which is the standard measure of data quality for comparing census products. The GNR is measured by combining non-responses for households and individual questions and comparing that to the number of households and questions included in enumeration. The national GNR for the 2016 short-form and long-form questionnaires is 4.00 per cent and 5.10 per cent respectively. In 2011, Statistics Canada replaced the long-form questionnaire with the 2011 National Household Survey (NHS). The most substantive change between previous and later long-form enumerations and the NHS is that the NHS was voluntary. As a result, the 2011 NHS has a GNR of 26.10 per cent. Having a higher GNR means there is a higher risk of non-response bias.
The 2016 Census provides good coverage of the population (97.4 per cent response rate) and high data quality (low GNR). While data quality from the census is often very good, the expense and effort required to collect so much information limits the frequency at which it can be collected to once every five years. The most recent data available is from the 2016 enumeration period and data releases can take up to two years following the enumeration. The next census enumeration will take place in 2021. To help fill the data gaps between census years there are other Statistics Canada products that are used to produce interim estimates, such as the LFS.
Another limitation of the 2016 Census, for the purposes of this report, is missing data from 14 Indigenous reserves and settlements that were not enumerated. The population and dwelling counts from the 14 Indigenous reserves and settlements are not included in the 2016 estimates or tables. The impact of this missing data on a national level for a broad analysis of the Indigenous or non-Indigenous population is small because missing data are relatively small in comparison to the population of interest. The effects of this missing data could be more significant when looking at lower-level geographic areas that would include the missing reserves and settlements (Statistics Canada, 2017a).6
2.1.4 The Labour Force Survey
The LFS is a household survey that is enumerated monthly to primarily examine the labour market and estimate individuals’ employment, unemployment, and labour force participation in Canada. The LFS provides additional information on age, sex, marital status, educational attainment, Indigenous identity, occupation group, income, and hours worked. The LFS targets individuals aged 15 years and older. Questions regarding Indigenous identity, defined as persons who reported being First Nations, Métis, or Inuk (Inuit), were extended to surveys in all provinces in 2007 to provide labour force insights regarding the off-reserve Indigenous population. The LFS has a much smaller sample size than the short-form census questionnaire, which is sent to all Canadian households (approximately 56,000 households compared to over 14 million households in 2016, respectively) and it does not include Indigenous reserves or settlements due to challenges with consistent access to respondents and travel costs to reach remote or rural areas. In addition to Indigenous reserves or settlements, the LFS excludes residents inhabiting institutions,7 full-time members of the armed forces, and some households in remote areas with small population densities. Together these groups make up less than 2 per cent of the Canadian population aged 15 years and older, so their omission is insubstantial and is unlikely to lead to significant non-response bias (Statistics Canada, 2020a). The average non-response rate for the enumeration of eligible households8 in the LFS is 10 per cent and is accounted for through weighting adjustments and imputations that ensure the LFS estimates reflect characteristics of the Canadian population estimated in the 2016 Census.
Due to the relatively small sample size of the LFS and the requirements of the Statistics Act, the level of detail available from the LFS is limited relative to products with larger sample sizes like the 2016 Census. For instance, when there is a risk of imprecise estimates due to small sample size, sampling error, or bias due to non-response, the table will either be flagged to alert the user of the potential for low quality data or suppressed entirely. The suppression of estimates in Statistics Canada products is used to meet the confidentiality requirements of the Statistics Act and prevent the identification of individuals. Area suppression is a common problem when trying to extract data for geographic regions that have small population counts or survey response counts. Suppression is also common when looking at a cross section of multiple different characteristics. For example, we are unable to retrieve data on engineers who are Indigenous, female, between the ages of 25 and 64, and live in Manitoba because there is a risk that the resulting table could identify individual respondents. For these reasons, the majority of data we requested from the LFS on Indigenous engineers is suppressed and unusable.
Data from the 2016 Census on Indigenous engineers are publicly available at the national level and for most provincial level analysis when considering only a small set of attributes (e.g. only grouping by gender and age, or by occupation type and education level). Publicly available data from the 2016 Census and LFS are unable to meet the needs of highly detailed analyses. For detailed analyses related to Indigenous engineers, for example, a detailed geographic analysis, primary data collection is required. Further discussion on primary data collection can be found in Section 4.0.
2.1.5 Other data sources
Other Statistics Canada products that we reviewed but did not include in our analysis were the 2006 Census, 2011 Census and NHS, and the APS. The census and NHS data products were omitted because the findings from these sources would be dated and due to the non-response limitations of the NHS discussed in Section 2.1.1.
The APS is a household survey of the off-reserve Indigenous population (First Nations, Métis, and Inuit) aged 15 years and older that provides data on social and economic conditions of Indigenous peoples. The final sample for the APS was generated from those individuals who identified as Indigenous or indicated having Indigenous ancestry in the 2016 Census. The APS sample contained over 43,000 household units that resulted in 32,330 responses (76 per cent response rate) (Statistics Canada, 2018). The APS includes information on occupation, job satisfaction, job acquisition processes, difficulties involved in looking for employment, resources that would help with finding employment, reasons for not working, labour mobility, and several other detailed questions regarding labour market activity. One limitation of the APS is the limited access to publicly published tables that include information on occupation. Information on respondent’s occupations can be found in the APS microdata files accessed through Statistics Canada’s Research Data Centres (RDCs) or through custom data table requests available for a fee. Overall, the APS is a good resource that complements the 2016 Census and could be used in future research to provide more context about the labour market experiences and education of Indigenous engineers.
2.2 Research questions
The following four research questions guide our analysis:
Q1. Which NOCs correspond to the professional engineers licensed by the 12 regulators?
Q2. How many Indigenous engineers are there in Canada? What other socio-demographic and labour market characteristics can we understand from secondary data about Indigenous engineers?
Q3. What can we infer about the diversity of professional engineers across the 12 regulators?
Q4. Which other variables related to the diversity of professional engineers in Canada are readily available from secondary sources (e.g. sex/gender, visible minority, recent immigrants etc.)?
3.0 Analysis
3.1 (Q1) Relevant National Occupational Classifications
NOCs provide a “systematic classification structure that categorizes the entire range of occupational activity in Canada for collecting, analyzing, and disseminating occupational data for labour market information and employment-related program administration” (Employment and Social Development Canada, 2020). The data we use from the 2016 Census provides NOCs between the one and four-digit level. Three-digit NOCs represent minor groupings of occupations and are the parent classification to four-digit NOCs, which represent unique occupations.
The NOC codes that correspond to the accredited engineering programs overseen by the 12 regulators are presented in Table 3.1. When referencing the general population of engineers, we include these same four NOCs:
- NOC 213: Civil, mechanical, electrical, and chemical engineers;
- NOC 214: Other engineers;
- NOC 0211: Engineering managers; and
- NOC 2173: Software engineers.
NOC |
Occupation Title |
| 0211 | Engineering managers |
| 213 | Civil, mechanical, electrical, and chemical engineers |
| 2131 | Civil engineers |
| 2132 | Mechanical engineers |
| 2133 | Electrical and electronics engineers |
| 2134 | Chemical engineers |
| 214 | Other engineers |
| 2141 | Industrial and manufacturing engineers |
| 2142 | Metallurgical and materials engineers |
| 2143 | Mining engineers |
| 2144 | Geological engineers |
| 2145 | Petroleum engineers |
| 2146 | Aerospace engineers |
| 2147 | Computer engineers (except software engineers and designers) |
| 2148 | Other professional engineers, n.e.c. |
| 2173 | Software engineers |
Source: Employment and Social Development Canada & Statistics Canada, 2016, National Occupational Classification
3.2 (Q2) Number and characteristics of Indigenous engineers in Canada
This section provides an overview of characteristics for Indigenous and non-Indigenous engineers at the national level. The seven subsections within this section provide information on: the number of Indigenous engineers in Canada, the representation of Indigenous people within engineering in comparison to Indigenous representation in the labour force and in the Canadian population, the level of educational attainment for Indigenous engineers, the specific engineering occupation with the highest proportion of Indigenous engineers, the distribution of engineers by Indigenous identity, the demographic breakdown between Indigenous and non-Indigenous engineers, and the median incomes of Indigenous and non-Indigenous engineers.
3.2.1 Indigenous representation in engineering
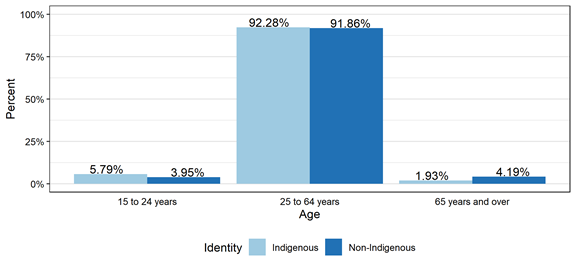
We are interested in the number of Indigenous people in engineering to understand the extent to which they are underrepresented. It is a simple exercise to estimate the percentage of engineers that are Indigenous, but it is more challenging to develop a reasonable benchmark for the percentage of Indigenous engineers that would represent a desired level of diversity, equity, and inclusion. The simplest benchmark is the percentage of Indigenous representation in Canada overall. However, this benchmark does not take into account demographic differences between the Indigenous and non-Indigenous populations. Specifically, as demonstrated in Figure 3.2.1, the Indigenous population is substantially younger than the non-Indigenous population. This is relevant because engineers are generally over 24 years of age due to licensing requirements. In short, to be a licensed engineer and to access engineering occupations requires a university degree in addition to other prerequisites that take time to obtain. The demographic discrepancy between the Indigenous and non-Indigenous population suggests that using the overall rate of Indigenous representation in the Canadian population would produce a benchmark that is too high because we cannot expect a significant number of engineers under the age of 24.
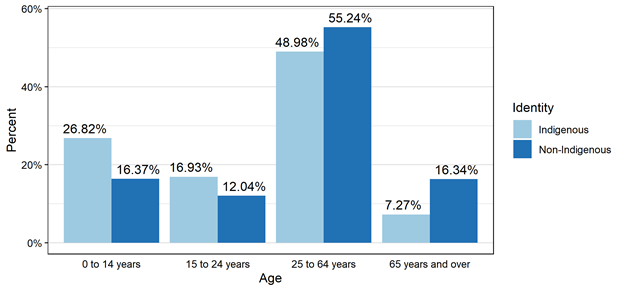
Source: Statistics Canada, 2016 Census of Population, Statistics Canada Catalogue no. 98-400-X2016357
Considering the different age distributions between the Indigenous and non-Indigenous populations in the development of a suitable benchmark for Indigenous inclusion in engineering is a start, but we must also consider the differences in the participation rate in the two populations. The participation rate is the ratio of the labour force (employed + unemployed) to the total population. The participation rate in the Indigenous population in their main working years tends to be lower than in the non-Indigenous population, and in 2016 this was indeed the case, as presented in Figure 3.2.2. If we were to ignore the discrepancy between the Indigenous and non-Indigenous populations in terms of the participation rate in establishing our benchmark for diversity, equity, and inclusion, we would be setting a high benchmark because we would not generally expect people who are currently out of the labour force to be engineers, nor do we have an interest in increasing the number of Indigenous engineers who are not in the labour force. Further, we account for the difference in the participation rate between the Indigenous and non-Indigenous population because it is unreasonable to expect that the policies and programs that Engineers Canada can deliver will be able to materially change labour force participation in the Indigenous population.

Source: Statistics Canada, 2016 Census of Population, Statistics Canada Catalogue no. 98-400-X2016266
Figure 3.2.3 compares the representation of Indigenous people in engineering and the representation of Indigenous people in the labour force in their main working years, our benchmark for equitable Indigenous inclusion in engineering. Only 0.93 per cent (2,870) of Indigenous people in their main working years are engineers. Accounting for the younger Indigenous population and lower Indigenous participation in the labour force produces an Engineers Canada benchmark for Indigenous inclusion of 3.15 per cent of the engineering workforce. By this benchmark, for the engineering profession to include a representative number of Indigenous people, an additional 6,820 Indigenous people in engineering occupations are required.
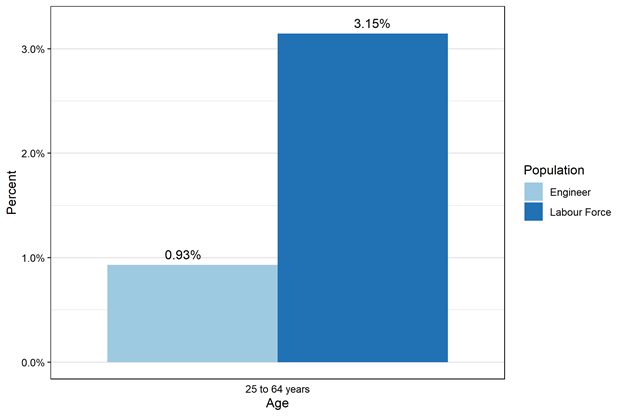
Source: Statistics Canada, 2016 Census of Population, Statistics Canada Catalogue no. 98-400-X2016357 and no. 98-400-X2016266
Notes: Total population counts, labour force counts, and engineer counts are for individuals aged 15 and over. Counts of engineers are derived from the NOC codes 0211 - Engineering Managers, 213 - Civil, mechanical, electrical, and chemical engineers, 214 - Other engineers, and 2173 - Software engineers. Indigenous populations include those who identify as First Nations, Métis, Inuit, Registered or Treaty Indians, and/or those who have membership in a First Nation band. All educational attainment levels are included.
3.2.2 Challenges with census data identifying professional engineers
Professional engineers are licensed by the 12 provincial and territorial engineering regulators. The information we are reporting here is derived from the 2016 Census, which asks about respondents’ occupation, but it does not include a question that would allow us to definitively determine whether or not they are licenced by the engineering regulators. However, because an individual must “hold an engineering degree from a Canadian Engineering Accreditation Board-accredited undergraduate program or possess equivalent qualifications” to be licenced, we restrict our analysis in this section to those individuals who both report engineering as their profession and have an education at a bachelor level or above.
When we consider only engineers in their main working years with an education at a bachelor level or above, only 0.73 per cent identify as Indigenous. Figure 3.2.4 shows the transition from the simplest benchmark approach (overall Indigenous representation in engineering) to the more restrictive analysis of the presence of Indigenous engineers in the engineering profession. This restrictive benchmark approach produces an estimate of 1,685 Indigenous engineers that are in the labour force, of main working years, and have an education level of a bachelor or above. If we use this more restrictive estimate of Indigenous representation among professional engineers, we require an additional 5,620 Indigenous engineers to achieve our benchmark of 3.15 per cent Indigenous representation in engineering.
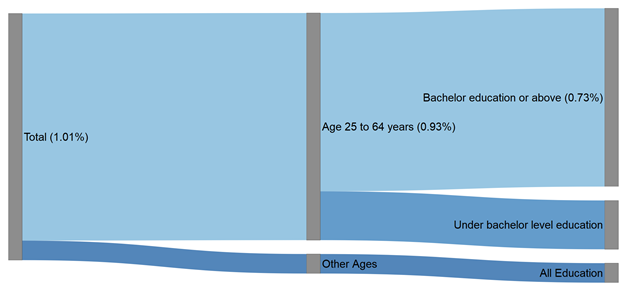
Source: Statistics Canada, 2016 Census of Population, Statistics Canada Catalogue no. 98-400-X2016357
Notes: Counts of engineers are derived from the NOC codes 0211 - Engineering Managers, 213 - Civil, mechanical, electrical, and chemical engineers, 214 - Other engineers, and 2173 - Software engineers. STEM occupation NOC codes are derived from the WorkBC Labour Market Outlook Profile. All educational attainment levels are included. Indigenous populations include those who identify as First Nations, Métis, Inuit, Registered or Treaty Indians, and/or those who have membership in a First Nation band.
3.2.3 Engineering relative to other technical occupations
In Figure 3.2.5 we compare the percentage of the Indigenous labour force across different occupation types for individuals in their main working years with an education at the bachelor level or above. Indigenous representation is particularly low in engineering (0.73 per cent) compared to science, technology, and math (STM) occupations (0.94 per cent) and the rest of the labour force (1.83 per cent). For those with an education at a bachelor level or above, representation of Indigenous people in engineering is less than half that of the broader labour force.
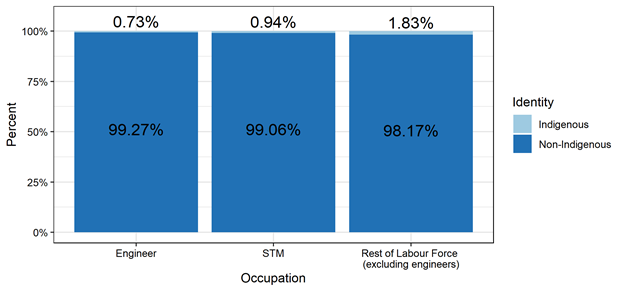
Source: Statistics Canada, 2016 Census of Population, Statistics Canada Catalogue no. 98-400-X2016357
Notes: Counts of engineers are derived from the NOC codes 0211 - Engineering Managers, 213 - Civil, mechanical, electrical, and chemical engineers, 214 - Other engineers, and 2173 - Software engineers. STEM occupation NOC codes are derived from the WorkBC Labour Market Outlook Profile. All educational attainment levels are included. Indigenous populations include those who identify as First Nations, Métis, Inuit, Registered or Treaty Indians, and/or those who have membership in a First Nation band.
3.2.4 Education
In Section 3.2.1 and 3.2.2, we examined subsets of the population (e.g. main working years) in order to establish a reasonable benchmark for diversity, equity, and inclusion of the Indigenous population in engineering and to understand the current level of Indigenous representation in engineering. In this, and future sections, we drop the main working years and education level restrictions and present data for the population aged 15 years and older. This broader analysis is done to provide an overall understanding of where Engineers Canada could effectively direct their efforts to better support Indigenous engineers and promote diversity, equity, and inclusion for different levels of education, in different provinces, for specific engineering occupations, and across various demographic groups. Figure 3.2.6 presents the distribution of engineers by highest level of educational attainment. Relative to Indigenous engineers, a higher percentage of non-Indigenous engineers have completed a university certification, diploma, or degree at a bachelor level or above. The implications of this finding are discussed in Section 3.2.2.
Source: Statistics Canada, 2016 Census of Population, Statistics Canada Catalogue no. 98-400-X2016357
Notes: Counts of engineers are derived from the NOC codes 0211 - Engineering Managers, 213 - Civil, mechanical, electrical, and chemical engineers, 214 - Other engineers, and 2173 - Software engineers. STEM occupation NOC codes are derived from the WorkBC Labour Market Outlook Profile. Indigenous populations include those who identify as First Nations, Métis, Inuit, Registered or Treaty Indians, and/or those who have membership in a First Nation band.
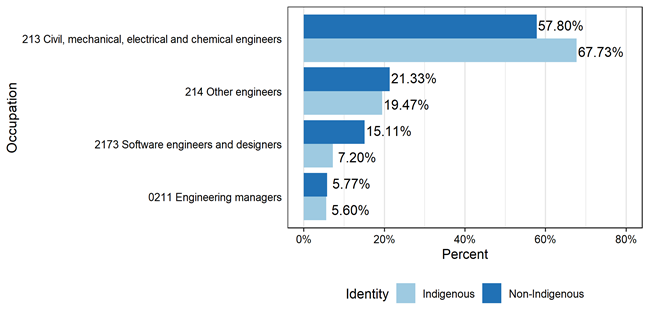
3.2.5 Engineering specialization and Indigenous identity
There are four sub-categories within engineering represented by the following NOCs:
- NOC 213 - Civil, mechanical, electrical and chemical engineers
- NOC 214 - Other engineers (industrial, petroleum, mining, etc.)
- NOC 2173 - Software engineers
- NOC 0211 - Engineering managers
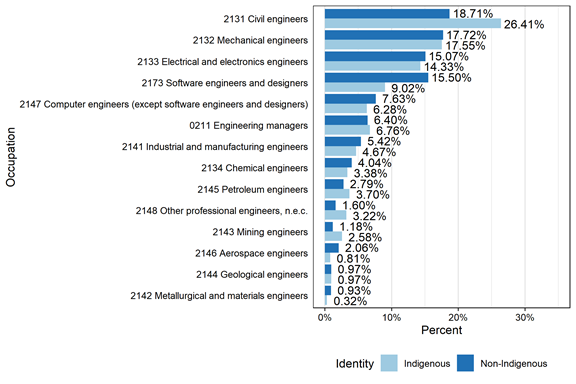
Figure 3.2.7 presents the distribution of Indigenous and non-Indigenous engineers among these sub-categories for individuals with university education at the bachelor level or above. The percentage of Indigenous and non-Indigenous engineers is similar for those in NOC groups 214 and 0211. The highest percentage of Indigenous engineers work in NOC 213 occupations as civil, mechanical, electrical, or chemical engineers (67.73 per cent). There is a lower percentage of Indigenous engineers in positions like software engineering and designer roles, compared to non-Indigenous engineers (7.2 per cent versus 15 per cent). A further breakdown of engineering occupations at the four-digit NOC level is provided in Figure A.1 in the Appendix. The analysis at the four-digit NOC level is similar to the distribution for three-digit NOCs provided in Figure 3.2.7.
Source: Statistics Canada, 2016 Census of Population, Statistics Canada Catalogue no. 98-400-X2016357
Notes: Education is filtered for individuals who have a university education at the bachelor level or above. Indigenous populations include those who identify as First Nations, Métis, Inuit, Registered or Treaty Indians, and/or those who have membership in a First Nation band.
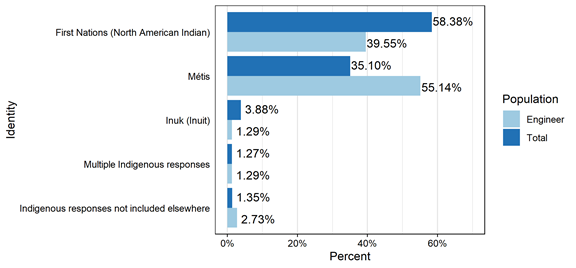
Figure 3.2.8 shows the percentage of engineers by their reported Indigenous identity for all levels of education. Of the respondents, 55.14 per cent identify as being Métis, 39.55 per cent identify as being First Nations, and the remaining 5.31 per cent identify as being Inuk, having multiple Indigenous identities, or did not fit into the other categories provided. Individuals who identify as Métis are overrepresented in engineering compared to the general Indigenous population and those who identify as First Nations and Inuk are underrepresented in engineering.
Engineers Canada may want to consider an identity-specific approach to diversity, equity, and inclusion instead of a pan-Indigenous approach. In general, the National Indigenous Organizations (NIO), the Assembly of First Nations (AFN), Inuit Tapiriit Kanatami (ITK), and Métis National Council (MNC) that represent the respective Indigenous populations in Canada prefer an identity-specific approach as it is able to consider the specific circumstances of First Nations, Métis, and Inuit.
Source: Statistics Canada, 2016 Census of Population, Statistics Canada Catalogue no. 98-400-X2016357
Notes: Counts of engineers are derived from the NOC codes 0211 - Engineering Managers, 213 - Civil, mechanical, electrical, and chemical engineers, 214 - Other engineers, and 2173 - Software engineers. All educational attainment levels are included.
3.2.6 Demographics
The distribution, in terms of age and sex, among Indigenous and non-Indigenous engineers is similar. Regardless of Indigenous identity, 92 per cent of engineers are in their main working years. There is a slightly higher percentage of non-Indigenous engineers over the age of 65 (four per cent non-Indigenous compared to two per cent Indigenous). A more detailed analysis of the distribution of engineers by age can be found in Figure A.2 of the Appendix.
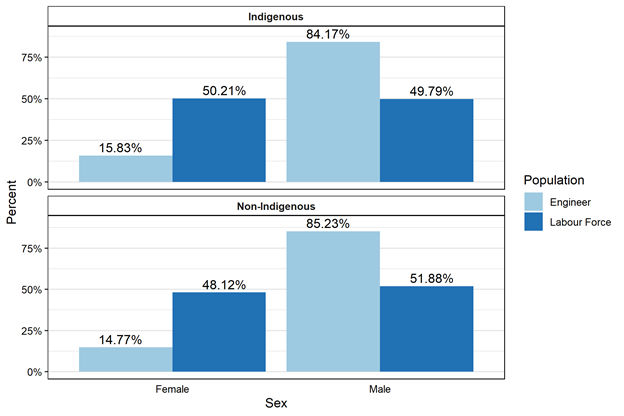
In terms of sex, we find that females are underrepresented in engineering in both the Indigenous and non-Indigenous population relative to their representation in the labour force.
Figure 3.2.9 presents the Indigenous engineering and labour force populations by sex for individuals in their main working years. In the Indigenous labour force, there is an almost equal distribution of female and male workers (50.21 per cent female, 49.79 per cent male), but within engineering only 15.83 per cent of Indigenous engineers are female compared to 84.17 per cent who are male. This imbalance between males and females in engineering is also found among non-Indigenous engineers where 14.77 per cent are female and 85.23 per cent are male. The slightly higher percentage of Indigenous females in the labour force compared to non-Indigenous females is reflected in the engineering workforce, where the distribution of Indigenous female engineers is just over one per cent higher than non-Indigenous female engineers (15.83 per cent and 14.77 per cent, respectively).
Source: Statistics Canada, 2016 Census of Population, Statistics Canada Catalogue no. 98-400-X2016357 and no. 98-400-X2016266
Notes: Counts of engineers are derived from the NOC codes 0211 - Engineering Managers, 213 - Civil, mechanical, electrical, and chemical engineers, 214 - Other engineers, and 2173 - Software engineers. Indigenous populations include those who identify as First Nations, Métis, Inuit, Registered or Treaty Indians, and/or those who have membership in a First Nation band.
3.2.7 Income
Figure 3.2.10 presents median income by age for Indigenous and non-Indigenous engineers that have a university education at the bachelor level or above. Data for Indigenous engineers over the age of 65 have been suppressed, indicating that the counts in that age group are very low, even at the national level.
On average, for those in their main working years, Indigenous engineers, that is, individuals in engineering occupations, as described in Section 2.1.2 and listed in Section 3.1, earned slightly more ($1,500) than non-Indigenous engineers in 2015.
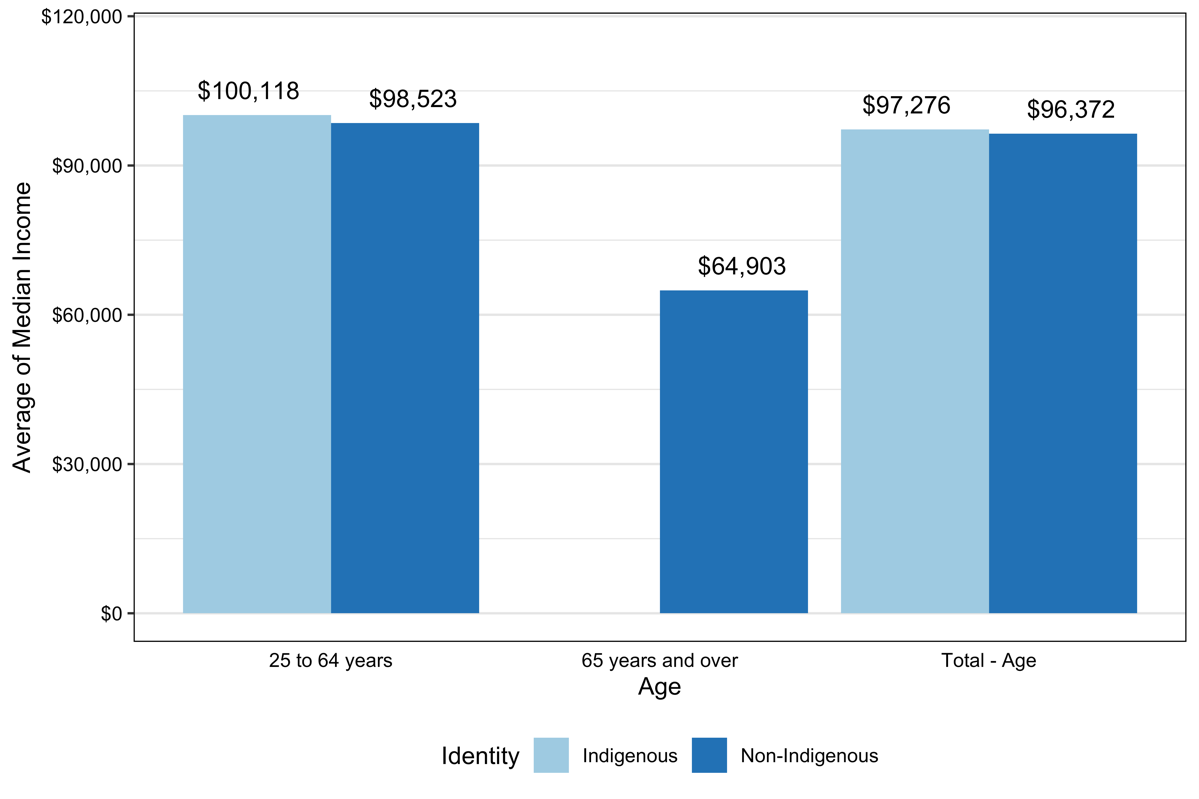
Source: Statistics Canada, 2016 Census of Population, Statistics Canada Catalogue no. 98-400-X201635?7
Notes: Counts of engineers are derived from the NOC codes 0211 - Engineering Managers, 213 - Civil, mechanical, electrical, and chemical engineers, 214 - Other engineers, and 2173 - Software engineers. Education is filtered for individuals who have a university education at the bachelor level or above. Indigenous populations include those who identify as First Nations, Métis, Inuit, Registered or Treaty Indians, and/or those who have membership in a First Nation band. Within the age group of engineers 65 and over, 55% “worked part year, part time or full time", 37% "Worked full year full time", and 8% "Worked full year part time". The lack of full year full time work is most likely driving the lower median income for this demographic of engineers.
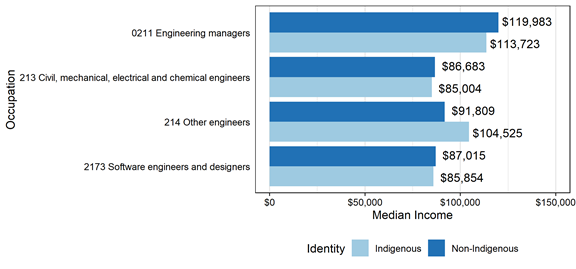
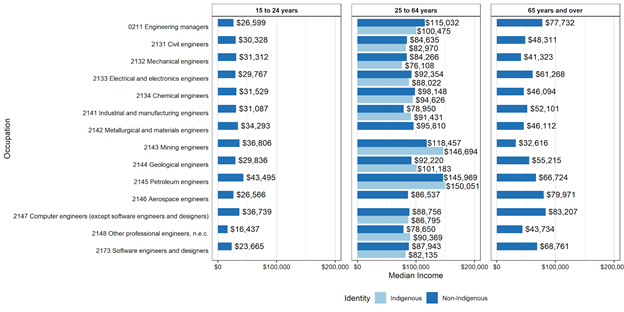
Figure 3.2.11 looks at the median income by age for engineers who have a university education at the bachelor level or above. Engineering managers have the highest median income for both Indigenous and non-Indigenous engineers, although non-Indigenous engineering managers make an estimated $6,300 more than Indigenous engineering managers. Non-Indigenous engineers have a higher median income than Indigenous engineers in every sub-category except for NOC 214, Other engineers, for which Indigenous engineers make almost $13,000 more than non-Indigenous engineers. The unique occupations included in NOC 214 are listed in Table 1.1. The remaining occupations included in NOCs 213 and 2173 have similar median incomes between Indigenous and non-Indigenous populations.
Source: Statistics Canada, 2016 Census of Population, Statistics Canada Catalogue no. 98-400-X2016357??
Notes: All educational attainment levels are included. Indigenous populations include those who identify as First Nations, Métis, Inuit, Registered or Treaty Indians, and/or those who have membership in a First Nation band.
3.3 (Q3) Regional diversity of professional engineers
In order to guide the implementation of strategies to increase diversity among professional engineers and identify opportunities to work with engineering regulators, we have examined 2016 Census data by province and territory to roughly align with the regulators’ jurisdictions.
Counts of Indigenous engineers by level of educational attainment can be seen in Table 3.3.1. It is important to note that due to random rounding9 in the 2016 Census, in the regions with an already low number of Indigenous engineers, it is hard to determine the actual changes in counts of engineers with and without higher levels of education. For example, random rounding explains why Newfoundland and Labrador sees an increase in the estimated number of Indigenous engineers when restricting education to only bachelor level or above.
| Geography | All education levels | University education at bachelor level or above |
|
Alberta |
600 |
375 |
|
British Columbia / Colombie-Britannique |
420 |
245 |
|
Manitoba |
225 |
120 |
|
New Brunswick / Nouveau-Brunswick |
30 |
35 |
|
Newfoundland and Labrador / Terre-Neuve-et-Labrador |
175 |
95 |
|
Northwest Territories / Territoires du Nord-Ouest |
20 |
0 |
|
Nova Scotia / Nouvelle-Écosse |
150 |
95 |
|
Nunavut |
0 |
0 |
|
Ontario |
845 |
440 |
|
Prince Edward Island / Île-du-Prince-Édouard |
10 |
0 |
|
Quebec / Québec |
410 |
325 |
|
Saskatchewan |
190 |
130 |
|
Yukon |
20 |
20 |
|
Canada |
3105 |
1875 |
Source: Statistics Canada, 2016 Census of Population, Statistics Canada Catalogue no. 98-400-X2016357
Notes: Only individuals of Indigenous status are included in the analysis. Counts of engineers are derived from the NOC codes 0211 - Engineering Managers, 213 - Civil, mechanical, electrical, and chemical engineers, 214 - Other engineers, and 2173 - Software engineers. Indigenous populations include those who identify as First Nations, Métis, Inuit, Registered or Treaty Indians, and/or those who have membership in a First Nation band.
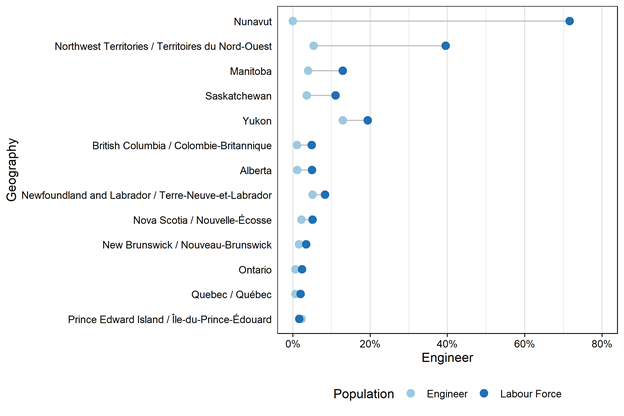
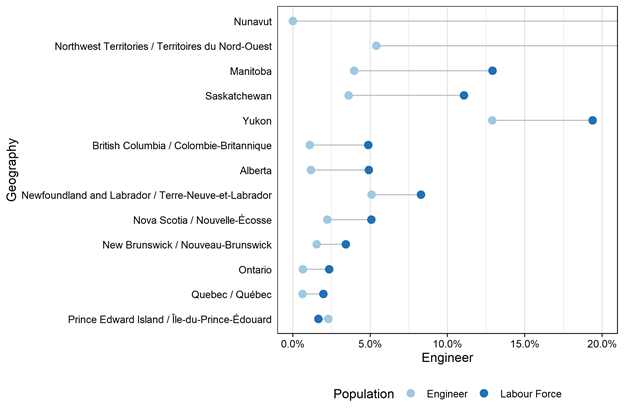
Figures 3.3.1 and 3.3.2 present the percentage of Indigenous engineers relative to the percentage of Indigenous people in the labour force across provinces and territories for individuals in their main working years. Figure 3.3.1 includes all measures of representation, whereas Figure 3.3.2 excludes any percentages over 20 per cent and in doing so provides a closer look at jurisdictions that have smaller variations in Indigenous representation. To facilitate specific comparisons, the percentages presented in Figure 3.3.1 are provided in Table 3.3.2. Indigenous engineers are underrepresented in each province except Prince Edward Island (P.E.I), where the percentage of Indigenous engineers is 2.33 per cent, which is higher than the representation of Indigenous people P.E.I’s labour force (1.64 per cent). Nunavut has the highest gap in terms of Indigenous representation in engineering, reporting that zero per cent of engineers are Indigenous compared to Nunavut’s labour force that is 71.58 per cent Indigenous. Other major gaps in representation are found in Northwest Territories, Manitoba, Saskatchewan, and Yukon. However, Northwest Territories and Yukon also have the highest percentage of Indigenous engineers, along with Newfoundland and Labrador. Primary data collection would be useful to determine additional contextual information regarding the paths and experiences of Indigenous engineers in regions with more equitable representation compared to regions that have large underrepresentation of Indigenous engineers.
Source: Statistics Canada, 2016 Census of Population, Statistics Canada Catalogue no. 98-400-X2016357 and no. 98-400-X2016266?
Notes: Counts of engineers are derived from the NOC codes 0211 - Engineering Managers, 213 - Civil, mechanical, electrical, and chemical engineers, 214 - Other engineers, and 2173 - Software engineers. Indigenous populations include those who identify as First Nations, Métis, Inuit, Registered or Treaty Indians, and/or those who have membership in a First Nation band.
Source: Statistics Canada, 2016 Census of Population, Statistics Canada Catalogue no. 98-400-X2016357 and no. 98-400-X2016266
Notes: Counts of engineers are derived from the NOC codes 0211 - Engineering Managers, 213 - Civil, mechanical, electrical, and chemical engineers, 214 - Other engineers, and 2173 - Software engineers. Indigenous populations include those who identify as First Nations, Métis, Inuit, Registered or Treaty Indians, and/or those who have membership in a First Nation band.
*To better understand the variation across regions, the figure excludes rates for regions where the percentage of Indigenous people in the labour force is greater than 20%.
|
Geography |
Indigenous engineers |
Indigenous labour force |
Difference |
|
Nunavut |
0.00% |
71.58% |
-71.58% |
|
Northwest Territories / Territoires du Nord-Ouest |
5.41% |
39.50% |
-34.10% |
|
Manitoba |
3.96% |
12.92% |
-8.96% |
|
Saskatchewan |
3.60% |
11.07% |
-7.47% |
|
Yukon |
12.90% |
19.40% |
-6.49% |
|
British Columbia / Colombie-Britannique |
1.10% |
4.89% |
-3.78% |
|
Alberta |
1.17% |
4.92% |
-3.75% |
|
Newfoundland and Labrador /Terre-Neuve-et-Labrador |
5.09% |
8.29% |
-3.21% |
|
Nova Scotia / Nouvelle-Écosse |
2.23% |
5.07% |
-2.84% |
|
New Brunswick / Nouveau-Brunswick |
1.54% |
3.43% |
-1.89% |
|
Ontario |
0.65% |
2.35% |
-1.70% |
|
Quebec / Québec |
0.63% |
1.98% |
-1.35% |
|
Prince Edward Island / Île-du-Prince-Édouard |
2.30% |
1.64% |
0.66% |
Source: Statistics Canada, 2016 Census of Population, Statistics Canada Catalogue no. 98-400-X2016357 and no. 98-400-X2016266
Notes: Counts of engineers are derived from the NOC codes 0211 - Engineering Managers, 213 - Civil, mechanical, electrical, and chemical engineers, 214 - Other engineers, and 2173 - Software engineers. Indigenous populations include those who identify as First Nations, Métis, Inuit, Registered or Treaty Indians, and/or those who have membership in a First Nation band.
3.4 (Q4) Additional variables
This section presents additional variables available in the 2016 Census and other Statistics Canada products that could help to better understand diversity among professional engineers. Table 3.4.1 presents a list of diversity-related variables included in the 2016 Census. Understanding the representation of engineers among these additional groups can be achieved by investigating the intersection of engineering-related NOCs and these additional diversity-related variables. While some data tables that include both these diversity-related variables and occupational classification are publicly available, most would need to be obtained from Statistics Canada through a custom table request.
| Subject | Variables |
| Families, households and marital status | Opposite/same-sex married spouse or common-law partner |
| Opposite/same-sex status | |
| Language | First official language spoken |
| Home language | |
| Language spoken most often at home | |
| Other language(s) spoken regularly at home | |
| Language of work | |
| Language used most often at work | |
| Other language(s) used regularly at work | |
| Knowledge of official languages | |
| Mother tongue | |
| Immigration and ethnocultural diversity | Age at immigration |
| Citizenship | |
| Ethnic origin | |
| Generation status | |
| Immigrant status | |
| Place of birth | |
| Place of birth of father | |
| Place of birth of mother | |
| Population group | |
| Year of immigration | |
| Visible minority |
Source: Statistics Canada, Dictionary, Census of Population, 2016 (Employment and Social Development Canada, 2020)
To date, Statistics Canada census products have not collected information on the gender identities of people in Canada. In order to recognize the diversity of the Canadian population and better represent the identities of LGBTQ2+ respondents, the 2021 Census questionnaire will include the more precise term "sex at birth" and a new question about gender (Statistics Canada, 2019b). The 2021 Census will also collect information on religion, which was not included in the 2016 Census (Statistics Canada, 2020c).
Other statistical products and surveys from Statistics Canada include relevant diversity-related variables. Table 3.4.2 presents select programs and surveys capturing diversity-related variables of interest.
| Statistical product or survey | Diversity variable |
| Canadian Survey on Disability (CSD) | Disability |
| Canadian Community Health Survey - Annual component (CCHS) - 2020 | Sexual Orientation |
| Perceived Mental Health | |
| Perceived Physical Health | |
| National Household Survey (NHS) - 2011 | Religion |
| Longitudinal Immigration Database (IMDB) | Immigrant Status |
| Labour Force Survey (LFS) | Gender |
| Immigrant Status | |
| Country of origin | |
| Country of highest education |
Source: Statistics Canada, 2019a, 2013, 2016a, 2019c, 2020b)
These diversity variables are available at varying geographies, time periods, and level of aggregation depending on the statistical program or survey. The occupation classification system used within the survey or program varies between NOCs, the North American Industry Classification System (NAICS)10, and other occupation groupings of assorted detail. Each occupation classification provides varying degrees of precision when matching to engineering occupations. Accessing information at the intersection of diversity variables and engineering occupation classifications can be examined using NOC codes corresponding to engineering. When NOCs are not available for a survey or product, diversity variables can be examined using other occupation classifications or Major Field of Study to infer engineering occupation. A helpful resource that supports reflection and conversations on diversity is the Statistics Canada Centre for Gender, Diversity and Inclusion portal11. This portal can be used to explore data at a national and provincial level through a diversity and inclusion lens.
4.0 Recommendations for future research
To gain further understanding of the diversity of professional engineers, specifically Indigenous engineers, Engineers Canada would benefit from conducting a primary data collection exercise. Primary data collection involves determining a clearly articulated set of research questions that will guide the research process and be used to describe the information needs of the project. It is a complex undertaking that should be used when secondary data is unable to meet the research needs of the project. There are several different ways to gather primary data that can be adjusted based on the needs, budget, time, and secondary data available for the proposed research project.
The data used in this report are capable of producing analysis that highlights the current state of Indigenous engineers in terms of their representation, distribution, demographics, and some education and labour force characteristics. A highly detailed contextual analysis was not feasible given the limitations of the secondary data currently available. Primary data could provide insight on any specific question that is of interest to Engineers Canada or the regulators, and could also:
- Develop a more accurate count of professional engineers instead of using estimates for individuals working in an engineering occupation classified under the NOC system.
- Produce findings at lower geographic levels such as Census Metropolitan Areas (CMAs) and rural areas. This could be used to better understand the representation of Indigenous engineers across the 12 regulators and produce baseline counts that could be used to measure the progress of equity, diversity and inclusion by region.
- Conduct cross-sectional analysis at these lower geographic levels by producing estimates conditional on multiple factors, for example, the distribution of engineers by education level and specific engineering occupations for different CMAs.
- Determine the specific accredited post-secondary program and institution attended by professional engineers.
- Determine the path to employment after post-secondary education (PSE). For example:
- Did students participate in co-op or internship programs?
- Were they forced to relocate for work?
- What was their experience accessing education?
- Was funding a barrier?
- Was the physical location of the program a barrier?
- Investigate the distribution of Indigenous engineers among management and senior roles. For example:
- Is there a lack of Indigenous representation in senior engineering positions? If so, how does this influence the perception of achieving success, in terms of seniority, as an Indigenous engineer.
In terms of next steps, we recommend conducting minor additional secondary data analysis using the alternative variables discussed in Section 3.4 and ordering custom tabulations of the 2016 Census to push the available secondary data to its limits. Having exhausted the available secondary data, we recommend starting the process of collecting primary data. The main steps involved in a primary data collection exercise include:
- Holding a Statement of Objectives meeting that will be used to guide the project. The Statement of Objectives meeting and resulting document will define the information needs, users and use of the data, any operational definitions, the target population, the content of the survey, and the analysis plan. It will also consider the project timeline and budget, which will inform the method and depth of the data collection.
- Enumerating the survey. One potential method of enumerating would be to distribute questionnaires or conduct over the phone/online surveys through the regulators to their pool of current registrants. This enumeration could be done for a sample of the registrants or the total registrants, depending on the resources that are available.
- Validate the data for quality and accuracy. Valid and accurate data can be used to create the estimates, tables, and charts that have been previously planned in the Statements of Objectives.
- Draft an interim report that presents the findings and answers to the research questions.
- Produce visualizations and communications materials to disseminate the answers to the research questions.
There is also the opportunity to harness administrative data processes to better understand diversity among professional engineers. For example, questions related to Indigenous identity or other diversity-related categorizations could be included in the licensing and registration processes of the regulators. Implementing data collection processes to answer Engineer Canada’s research questions that use existing administrative data processes would allow for detailed analyses and, over time, a profound understanding of the diversity or lack thereof among professional engineers.
Finally, there is an opportunity for data sharing between Engineers Canada and the higher education institutions responsible for the delivery of accredited engineering programs. Linking information collected by Engineers Canada to data collected by higher education institutions could provide a comprehensive portrait of the engineering profession, its diversity, and the different paths that exist to becoming an engineer.
Appendix
Source: Statistics Canada, 2016 Census of Population, Statistics Canada Catalogue no. 98-400-X2016357?
Notes: All educational attainment levels are included. Indigenous populations include those who identify as First Nations, Métis, Inuit, Registered or Treaty Indians, and/or those who have membership in a First Nation band.
Source: Statistics Canada, 2016 Census of Population, Statistics Canada Catalogue no. 98-400-X2016357??
Notes: Counts of engineers are derived from the NOC codes 0211 - Engineering Managers, 213 - Civil, mechanical, electrical, and chemical engineers, 214 - Other engineers, and 2173 - Software engineers. All educational attainment levels are included. Indigenous populations include those who identify as First Nations, Métis, Inuit, Registered or Treaty Indians, and/or those who have membership in a First Nation band.
Source: Statistics Canada, 2016 Census of Population, Statistics Canada Catalogue no. 98-400-X2016357?
Notes: All educational attainment levels are included. Indigenous populations include those who identify as First Nations, Métis, Inuit, Registered or Treaty Indians, and/or those who have membership in a First
End notes
1 “The Truth and Reconciliation Commission was formed as a means of reckoning with the devastating legacy of forced assimilation and abuse left by the residential school system. From 2008 to 2014, the Truth and Reconciliation Commission heard stories from thousands of residential school survivors. In June 2015, the commission released a report based on those hearings. From that came the 94 Calls to Action: individual instructions to guide governments, communities and faith groups down the road to reconciliation” (Beyond 94, 2018).
2 The Canadian Indigenous Advisory Council provides guidance and support to the Canadian Indigenous Science and Engineering Society (caISES). caISES functions to support, mentor, and provide networking opportunities for Indigenous peoples in STEM through at all levels of their educational and professional experience (Canadian Region of AISES, 2018).
3 The Labour Force Survey, 2016 Census, Aboriginal Peoples Survey, and other Statistics Canada products use the term Aboriginal to refer to those who identify as First Nations, Métis, or Inuk (Inuit) within Canada. In this report we use the term Indigenous to refer to the same three groups.
4 The academic requirements for becoming a professional engineer include holding “an engineering degree from a Canadian Engineering Accreditation Board-accredited undergraduate program or possess equivalent qualifications” (Overview of the Licensing Process, 2020).
5 Indigenous identity is reported for individuals identifying as First Nations (North American Indian), Métis or Inuk (Inuit) and/or those who are Registered or Treaty Indians, and/or those who have membership in a First Nation or Indian band.
6 Because of incomplete enumeration the total count of missing data can only be estimated using instances where reserves and settlements have provided responses in previous census years.
7 Institutions refers to correctional facilities, prisons, or places housing those who are incarcerated
8 Eligible households are those that are not on an Indigenous reserve or settlement, not in an institution, not members of the armed forces, and do not reside in remote areas with very small population density. Eligible households reflect individuals who are capable of participating in the labour market and can be consistently accessed for data collection.
9 Statistics Canada rounds small values to either 0 or 5, (depending on other attributes in the table they may round to 0 or 10). For example, if a cell value is 2, but publicly releasing that precise value might risk identifying a respondent, it will be randomly rounded to 0 or 5. That is, the value that appears in the public table has the same probability of being 0 as it does 5, they do not round to the nearest value.
10 “NAICS is a comprehensive system encompassing all economic activities. It has a hierarchical structure. At the highest level, it divides the economy into 20 sectors. At lower levels, it further distinguishes the different economic activities in which businesses are engaged.” (Statistics Canada, 2018c)
11 https://www.statcan.gc.ca/eng/topics-start/gender_diversity_and_inclusion
References
About Diversity in Engineering. (2020). Engineers Canada. https://engineerscanada.ca/diversity/about-diversity-in-engineering
About Engineers Canada. (2020). Engineers Canada. https://engineerscanada.ca/about/about-engineers-canada
Beyond 94: Truth and Reconciliation in Canada. (2018, March 9). https://newsinteractives.cbc.ca/longform-single/beyond-94
Canadian Region of AISES. (2018, November 29). .CaISES – Canadian Region of AISES. AISES. https://www.aises.org/membership/caises
Calls to Action Accountability: A Status Update on Reconciliation. (2019, December 17). Yellowhead Institute. https://yellowheadinstitute.org/2019/12/17/calls-to-action-accountability-a-status-update-on-reconciliation/
Cathy MacDonald & Aubrey Steenbeek. (2015). The impact of colonization and western assimilation on health and wellbeing of Canadian Aboriginal People. International Journal of Regional and Local History. https://doi.org/10.1179/2051453015Z.00000000023
Employment and Social Development Canada, G. of C. (2020). National Occupational Classification—Canada.ca. https://noc.esdc.gc.ca/Home/Welcome/fbb28d676fc0486fbc04b531894a44bc?GoCTemplateCulture=en-CA
Employment and Social Development Canada, G. of C. (2019, September 26). 2016 Employment Equity Data Report. https://www.canada.ca/en/employment-social-development/services/labour-standards/reports/employment-equity-data-report-2016.html
Indigenous Peoples in Engineering. (2020). Engineers Canada. https://engineerscanada.ca/diversity/indigenous-peoples-in-engineering
Katherine Wall, Statistics Canada. (2019, May 2). Persistence and representation of women in STEM programs. https://www150.statcan.gc.ca/n1/pub/75-006-x/2019001/article/00006-eng.htm
Legislative Services, S. C. (2017, December 12). Consolidated federal laws of Canada, Statistics Act. https://laws-lois.justice.gc.ca/PDF/S-19.pdf
OECD. (2018). Indigenous labour market outcomes in Canada. In OECD, Indigenous Employment and Skills Strategies in Canada (pp. 19–46). OECD. https://doi.org/10.1787/9789264300477-6-en
Overview of the Licensing Process. (2020, August 6). Engineers Canada. https://engineerscanada.ca/become-an-engineer/overview-of-licensing-process
Statistics Canada, G. of C. (n.d.-b). About the National Occupational Classification—Government of Canada. Retrieved 14 July 2020, from https://noc.esdc.gc.ca/Home/AboutTheNoc/40ec1586ec1749a9967cb114c89fb445
Statistics Canada, G. of C. (2013, May 8). 2011 National Household Survey Profile. https://www12.statcan.gc.ca/nhs-enm/2011/dp-pd/prof/help-aide/aboutdata-aproposdonnees.cfm?Lang=E
Statistics Canada, G. of C. (2016a, November 14). Canadian Survey on Disability (CSD). https://www23.statcan.gc.ca/imdb/p2SV.pl?Function=getSurvey&SDDS=3251
Statistics Canada, G. of C. (2016b, November 16). Dictionary, Census of Population, 2016—Complete A to Z index. https://www12.statcan.gc.ca/census-recensement/2016/ref/dict/az1-eng.cfm
Statistics Canada, G. of C. (2017a, February 8). Guide to the Census of Population, 2016. Appendix 1.2 Incompletely enumerated Indian reserves and Indian settlements. https://www12.statcan.gc.ca/census-recensement/2016/ref/98-304/app-ann1-2-eng.cfm
Statistics Canada, G. of C. (2017b, February 8). Guide to the Census of Population, 2016. Chapter 10 – Data quality assessment. https://www12.statcan.gc.ca/census-recensement/2016/ref/98-304/chap10-eng.cfm
Statistics Canada, G. of C. (2017c, February 8). Guide to the Census of Population, 2016. Chapter 11 – Dissemination. https://www12.statcan.gc.ca/census-recensement/2016/ref/98-304/chap11-eng.cfm
Statistics Canada, G. of C. (2017d, March 16). Aboriginal People Living Off-Reserve and the Labour Market: Estimates from the Labour Force Survey, 2007 to 2015. https://www150.statcan.gc.ca/n1/pub/71-588-x/71-588-x2017001-eng.htm
Statistics Canada, G. of C. (2017f, October 25). Aboriginal Identity (9), Age (20), Registered or Treaty Indian Status (3) and Sex (3) for the Population in Private Households of Canada, Provinces and Territories, Census Metropolitan Areas and Census Agglomerations, 2016 Census—25% Sample Data. https://www12.statcan.gc.ca/census-recensement/2016/dp-pd/dt-td/Rp-eng.cfm?TABID=2&Lang=E&APATH=3&DETAIL=0&DIM=0&FL=A&FREE=0&GC=0&GID=1341679&GK=0&GRP=1&PID=110588&PRID=10&PTYPE=109445&S=0&SHOWALL=0&SUB=0&Temporal=2017&THEME=122&VID=0&VNAMEE=&VNAMEF=&D1=0&D2=0&D3=0&D4=0&D5=0&D6=0
Statistics Canada, G. of C. (2017g, October 25). Guide to the Census of Population, 2016. Chapter 9 – Sampling and weighting for the long form. https://www12.statcan.gc.ca/census-recensement/2016/ref/98-304/chap9-eng.cfm
Statistics Canada, G. of C. (2017h, November 29). Aboriginal Identity (9), Highest Certificate, Diploma or Degree (15), Labour Force Status (8), Registered or Treaty Indian Status (3), Residence by Aboriginal Geography (10), Age (10) and Sex (3) for the Population Aged 15 Years and Over in Private Households of Canada, Provinces and Territories, 2016 Census—25% Sample Data. https://www12.statcan.gc.ca/census-recensement/2016/dp-pd/dt-td/Rp-eng.cfm?LANG=E&APATH=3&DETAIL=0&DIM=0&FL=A&FREE=0&GC=0&GID=0&GK=0&GRP=1&PID=110668&PRID=10&PTYPE=109445&S=0&SHOWALL=0&SUB=0&Temporal=2017&THEME=124&VID=0&VNAMEE=&VNAMEF=
Statistics Canada, G. of C. (2018a, March 20). First Nations People, Métis and Inuit in Canada: Diverse and Growing Populations. https://www150.statcan.gc.ca/n1/pub/89-659-x/89-659-x2018001-eng.htm
Statistics Canada, G. of C. (2018b, March 28). Occupation—National Occupational Classification (NOC) 2016 (691), Employment Income Statistics (3), Highest Certificate, Diploma or Degree (7), Aboriginal Identity (9), Work Activity During the Reference Year (4), Age (4D) and Sex (3) for the Population Aged 15 Years and Over Who Worked in 2015 and Reported Employment Income in 2015, in Private Households of Canada, Provinces and Territories and Census Metropolitan Areas, 2016 Census—25% Sample Data. https://www12.statcan.gc.ca/census-recensement/2016/dp-pd/dt-td/Rp-eng.cfm?LANG=E&APATH=3&DETAIL=0&DIM=0&FL=A&FREE=0&GC=0&GID=0&GK=0&GRP=1&PID=112126&PRID=10&PTYPE=109445&S=0&SHOWALL=0&SUB=0&Temporal=2017&THEME=124&VID=0&VNAMEE=&VNAMEF=
Statistics Canada, G. of C. (2018c, May 10). 2016 Census, Employment by Aboriginal group and occupation. https://www150.statcan.gc.ca/t1/tbl1/en/cv.action?pid=1410010401
Statistics Canada, G. of C. (2018d, November 23). Aboriginal Peoples Survey (APS). https://www23.statcan.gc.ca/imdb/p2SV.pl?Function=getSurvey&SDDS=3250
Statistics Canada, G. of C. (2018e, September 4). Introduction to the North American Industry Classification System (NAICS) Canada 2017 Version 3.0. https://www.statcan.gc.ca/eng/subjects/standard/naics/2017/v3/introduction
Statistics Canada, G. of C. (2018f, September 7). Guide to the Labour Force Survey, 2018. https://www150.statcan.gc.ca/n1/pub/71-543-g/71-543-g2020001-eng.htm
Statistics Canada, G. of C. (2018h, November 26). Labour market experiences of First Nations people living off reserve: Key findings from the 2017 Aboriginal Peoples Survey. https://www150.statcan.gc.ca/n1/pub/89-653-x/89-653-x2018003-eng.htm
Statistics Canada. (2019a, November 22). Canadian Community Health Survey—Annual Component (CCHS). https://www23.statcan.gc.ca/imdb/p2SV.pl?Function=getSurvey&SDDS=3226
Statistics Canada, G. of C. (2019b, February 18). Sex and gender. https://www12.statcan.gc.ca/census-recensement/2021/road2021-chemin2021/fs-fi/sex-and-gender.cfm
Statistics Canada, G. of C. (2019c, December 18). Longitudinal Immigration Database (IMDB). https://www23.statcan.gc.ca/imdb/p2SV.pl?Function=getSurvey&Id=1267625
Statistics Canada, G. of C. (2020, May 12). Census of Population, Detailed information for 2021. https://www23.statcan.gc.ca/imdb/p2SV.pl?Function=getSurvey&SDDS=3901
Statistics Canada, G. of C. (2020a, January 10). Labour force characteristics by region and detailed Aboriginal group. https://www150.statcan.gc.ca/t1/tbl1/en/tv.action?pid=1410036501
Statistics Canada, G. of C. (2020b, January 14). Aboriginal Community Data Initiative Portrait, 2016 Census – Canada. https://www12.statcan.gc.ca/census-recensement/2016/dp-pd/abpopprof/infogrph/infgrph.cfm?LANG=E&DGUID=2016A000011124&PR=01
Statistics Canada, G. of C. (2020c, May 7). Labour Force Survey (LFS). https://www23.statcan.gc.ca/imdb/p2SV.pl?Function=getSurvey&SDDS=3701
Truth and Reconciliation Commission of Canada. (2015). Calls to Action.
What is NOC? / Skilled Immigrant InfoCentre. (n.d.). Retrieved 5 August 2020, from /siic/job-search-resources/what-is-noc/
List of abbreviations
2016 Census: 2016 Census of the Population
AFN: Assembly of First Nations
APS: 2017 Aboriginal Peoples Survey
CMA: Census Metropolitan Area
CU: collection unit
ESDC: Employment and Social Development Canada
GNR: global non-response rate
ITK: Inuit Tapiriit Kanatami
LFS: Labour Force Survey
Main working years: ages 25-64
MNC: Métis National Council
NAICS: North American Industry Classification System
NHS: 2011 National Household Survey
NIO: National indigenous Organizations
NOC: National Occupation Classifications
PSE: Post-secondary education
RDC: Research Data Centre
RTRA: Real Time Remote Access
STM: science, technology, and math
TRC: Truth and Reconciliation Commission of Canada