Data for 2021
1. Summary
Engineers Canada’s annual National Membership Report collects information from the provincial and territorial engineering regulators about their membership in order to paint a picture of the engineering profession in Canada. The 2022 report captures data from January 1, 2021, to December 31, 2021. Engineering members are categorized based on the definition of practice in each jurisdiction. Please find here all data tables associated with this report.
Overall, there was a slight increase in licensing and membership in 2021. These increases may be caused by the recovery from the COVID-19 pandemic, but further research is required to comprehensively understand the cause. Data presented in this report and future reports will allow us to better understand how global events impact the career trajectories of engineers in Canada.
2. Growth in the engineering profession
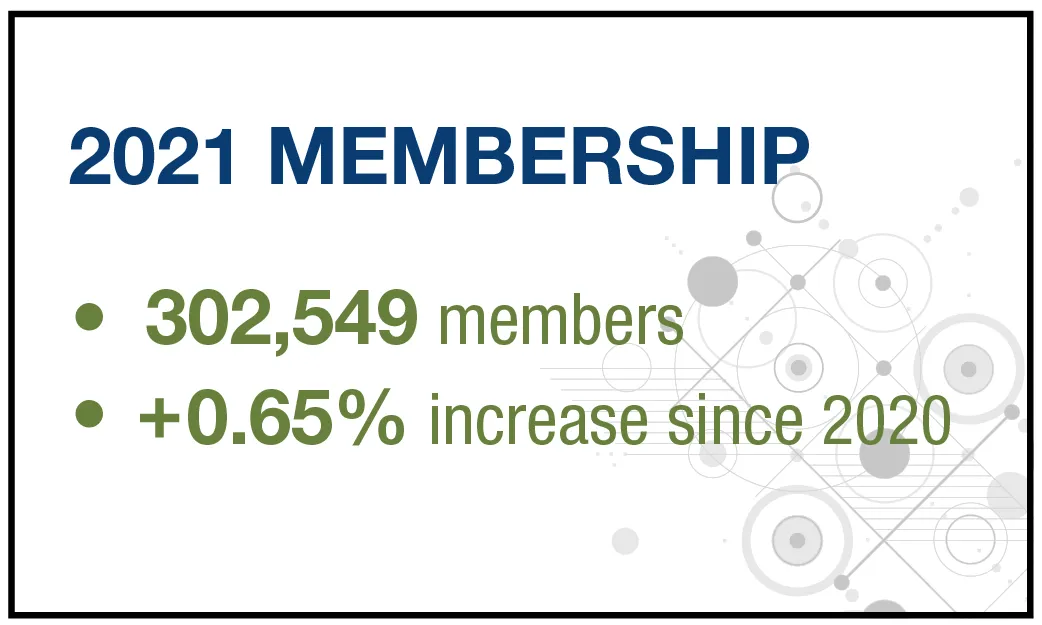
Membership in the provincial and territorial regulators increased slightly from 2020 to 2021. There were 302,549 members1 as of December 31, 2021, across the 12 engineering regulators comprising the national total membership (see Table 1). This is an increase of 1,944 members, or a 0.65 per cent increase from the previous year (in comparison, from 2019 to 2020 there was a decrease of 1.37 per cent).2 In 2021, the largest growth in numbers was seen in British Columbia (4,718 more members), and the greatest decline was seen in Alberta (3,272 fewer members).
3. Newly licensed engineers
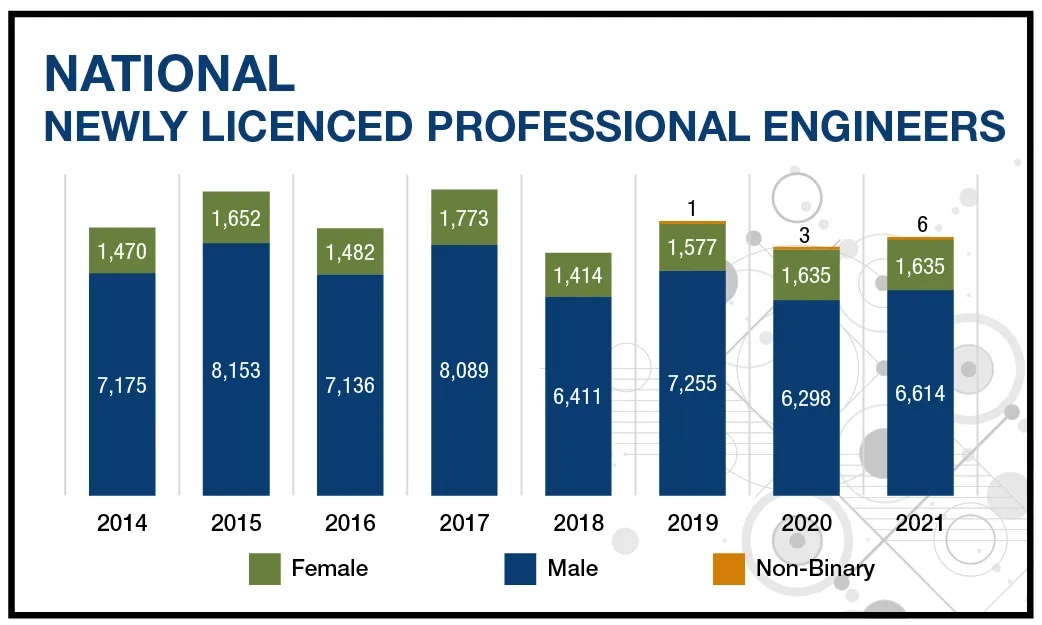
To understand the future of the profession, we track the number of newly licensed engineers 3 each year. There were 8,255 newly licensed engineers in 2021, with the largest number (2,581 engineers) obtaining their license through Professional Engineers Ontario (PEO) (see Table 2). For the eight-year trend in newly licensed engineers (2014 to 2021) see Table 3. Further analysis of the pathway to licensure is captured in the section, ‘Sex representation in engineering.’
4. Engineers-in-training
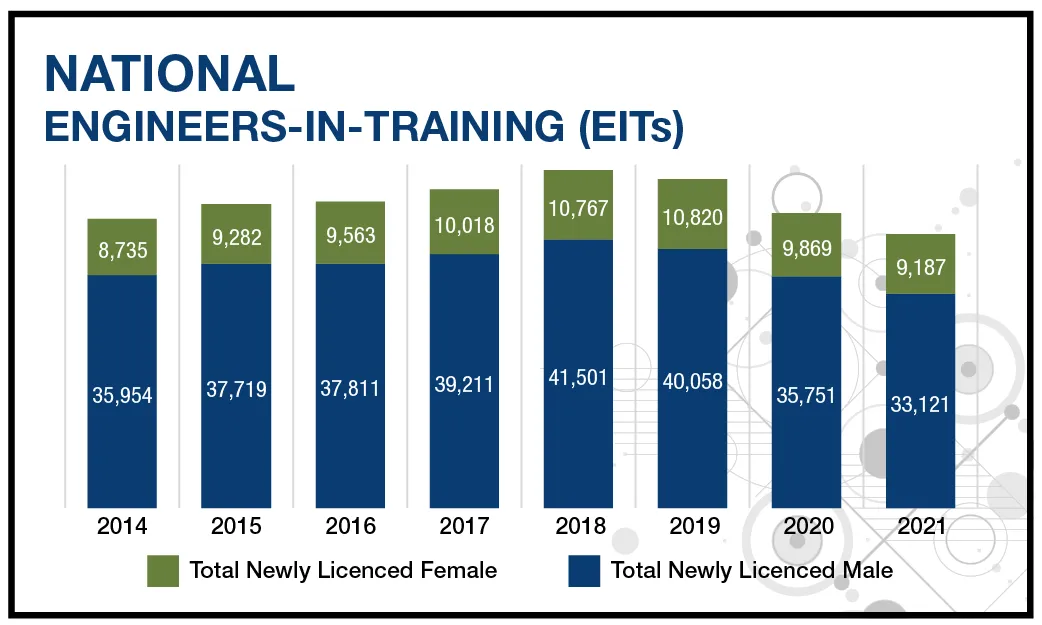
The number of engineers-in-training (EITs) decreased between 2020 and 2021, by 3,305 members. While the number of EITs decreased for all gender identities, the proportion of female-identifying EITs remains the same 21.6 per cent. See Table 4 for the national EIT data from 2014 to 2021.
5. Sex representation in engineering
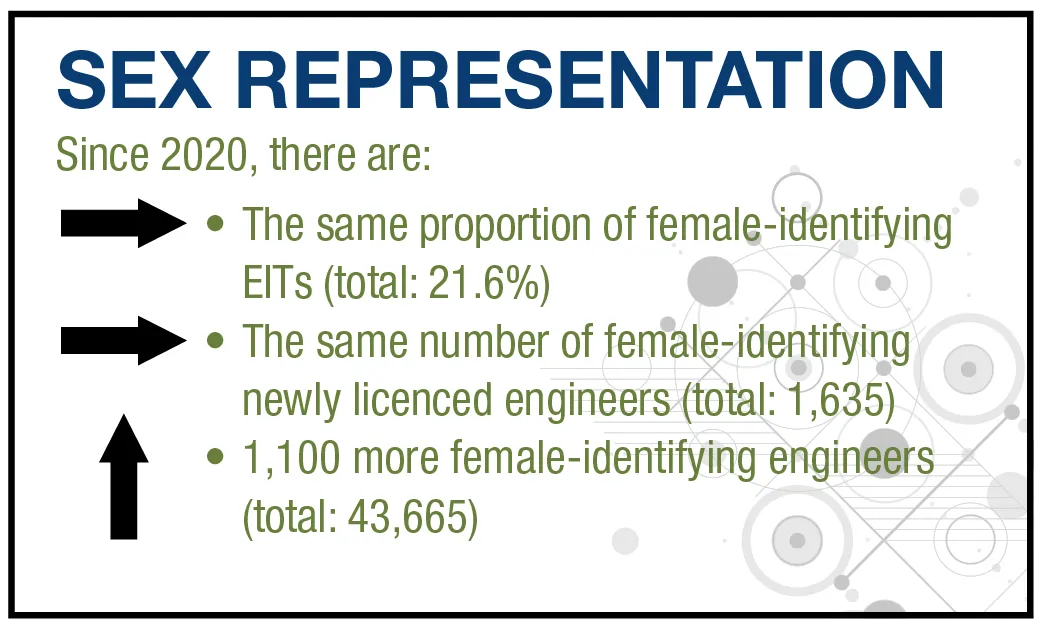
There are 43,665 female-identifying engineering members, representing 14.4 per cent of total national membership in 2021 (an increase from 14.2 per cent in 2020).4 This is an increase of 1,100 members who are female-identifying between 2020 and 2021. British Columbia (13.7 to 14.4 per cent) and Yukon (11.7 to 12.1 percent) achieved the largest increases with almost one per cent growth from 2020 to 2021.
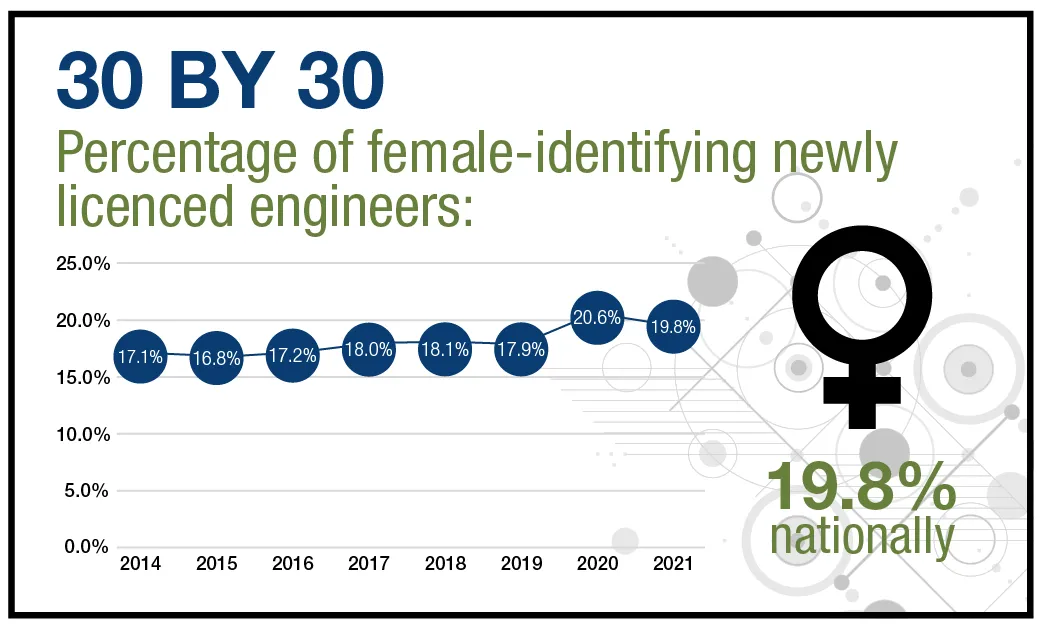
Engineers Canada and the regulators have been tracking the number of newly licensed female-identifying engineers since 2014, as part of the 30 by 30 initiative. In 2015, Engineers Canada launched the 30 by 30 initiative with support from the provincial and territorial regulators. 30 by 30 is a commitment to increasing the proportion of newly licensed engineers who are women to 30 per cent by 2030.
This is an important metric for tracking the impact of programs that support gender equity in engineering, since it marks a career milestone for women in their early careers, post-graduation from an accredited program, or for internationally trained engineers entering the Canadian job market.
Female-identifying engineers accounted for 19.8 per cent of newly licensed engineers in Canada in 2021 (see Table 2). The total number of female-identifying individuals obtaining their license in 2021 remained the same as the previous year at 1,635 members. The number of newly licensed male-identifying engineers increased in 2021, while the number of newly licensed female-identifying engineers remained the same, resulting in a higher proportion of male-identifying engineers.
The largest increases, by region, of newly licensed female-identifying engineers between 2020 and 2021, occurred in British Columbia (153 to 224) and Ontario (504 to 533). Newly licensed engineers increased overall by 5.09 per cent (7,936 in 2020 to 8,340 in 2021) (see Table 3).
Although the number of female-identifying EITs decreased in 2021, the overall proportion remained the same 21.6 percent in 2021. See Table 4 for the full breakdown of male and female-identifying EITs.
6. From engineering student to professional engineer
Gathering data on the number of engineering students helps us understand how the engineering profession might grow in the future.
According to Engineers Canada’s Enrolment and Degrees Awarded Report 2015-2020,5 there were 15,782 graduates from accredited post-secondary engineering programs in 2017. Assuming it takes a minimum of four years for a graduate from an accredited engineering program to obtain their professional licence, we can estimate that those 2017 graduates (Cohort A) would be obtaining their engineering licence in 2021 and would be captured in the number of newly licensed engineers in this year’s membership data. Using these figures, we can calculate an estimation of the national conversion from graduation to engineering licensure.
In 2021, CEAB graduates accounted for 5,999, or 71.9 per cent, of the total newly licensed engineers in Canada, which is a decrease from 72.6 per cent in 2020. Based on the number of newly licensed CEAB graduates in 2021, we estimate 38.0 per cent of Cohort A (15,782 graduates) proceeded along the path to licensure.
In 2016, there were 14,905 CEAB graduates (Cohort B). CEAB graduates accounted for 5,764, or 72.6 per cent, of the total newly licensed engineers in 2020. Using the same analysis as above, we can estimate that 38.7 per cent of Cohort B obtained their licensed in 2020.
Therefore, there is a decrease in the proportion of CEAB graduates obtaining their license after four years between Cohort A (2021) and Cohort B (2020). Although this is an estimation, it is an attempt at measuring the successful continuation of engineering students along the pathway to licensure. Given the impact of the global pandemic on the Canadian economy, early-career professionals may have experienced a slowed-down career progression in 2020. As described in section 3, the number of newly licensed engineers slightly increased between 2020 and 2021, from 7,936 to 8,340.
The analysis of graduation to licensure is particularly important in understanding the trend for 30 by 30 and how it relates to the increasing trend of female undergraduate enrolment and graduation. CEAB graduates make up the largest pool of potential engineers, including the largest number of newly licensed engineers who are female-identifying. Breaking down the numbers of Cohort A we see that 3,072 engineering graduates were female-identifying in 2017. In 2021, 1,240 CEAB graduates who are female-identifying were newly licensed by the regulators (Table 2). Using the four-year graduate-to-licensure estimation, we find 40.3 per cent licensure obtainment rate in 2021 for Cohort A who are female-identifying, which is slightly higher than the overall conversion rate for Cohort A (38.7 per cent). The graduate-to-licensure conversion for male-identifying Cohort A CEAB graduates was 37.9 per cent. Female-identifying engineering graduates are continuing on the pathway to licensure at a slightly higher rate than male-identifying colleagues upon graduation.
To find out more about the 30 by 30 initiative and the 30 by 30 Champions in your province, visit the 30 by 30 webpage.
Endnotes
1. The category, Members, includes Practising P.Eng.’s (exclusive), Temporary License Holders, License to Practise Holders, Restricted License Holders, Non-Practising P.Eng.’s, Life Members and Engineers-in-Training. It does not include students.
2. Engineers Canada, 2020. “2020 National Membership Information.” Engineers Canada, Ottawa, Canada. Available: https://engineerscanada.ca/2020-national-membership-information [Accessed June 10, 2021].
3. The category, Newly Licensed, includes individuals licensed as Professional Engineers for the first time that are Canadian Engineering Accreditation Board trained, Internationally trained, or have obtained their license by some other route. It does not include interprovincial mobility applicants.
4. Sex and gender definition: Sex identifiers have historically been limited to ‘male’ and ‘female’ in the survey of national membership. We use “female-identifying” to describe participants who selected female, and “male-identifying” to describe participants who selected male, be as literal as possible, to limit the assumptions between sex and gender identifiers, and to acknowledge the gender diversity that exists within these sex identities.
5. Engineers Canada, 2020. “Canadian engineers for tomorrow,” Engineers Canada, Ottawa, Canada. Available: https://engineerscanada.ca/reports/canadian-engineers-for-tomorrow-2019#total-undergraduate-degrees-awarded [Accessed July 13, 2021].