Executive Summary
Approximately 46 higher education institutions’ with Canadian Engineering Accreditation Board-accredited engineering programs were invited to participate in this study. They were asked to send the online survey to all final-year bachelor students registered in their engineering programs. In total, 2,222 of these students completed the 2016 survey.
Choice of engineering
For many graduates, the decision to become an engineer appears to start early in life. Partly, this decision seems to be influenced by knowing an engineer; about half of the students report knowing one when they were growing up. A significant majority (two in three students) made the decision to pursue engineering before or while they were in high school. Those who knew an engineer growing up (70 per cent) were more likely than those who did not (61 per cent) to have made the decision to pursue engineering before or while they were in high school.
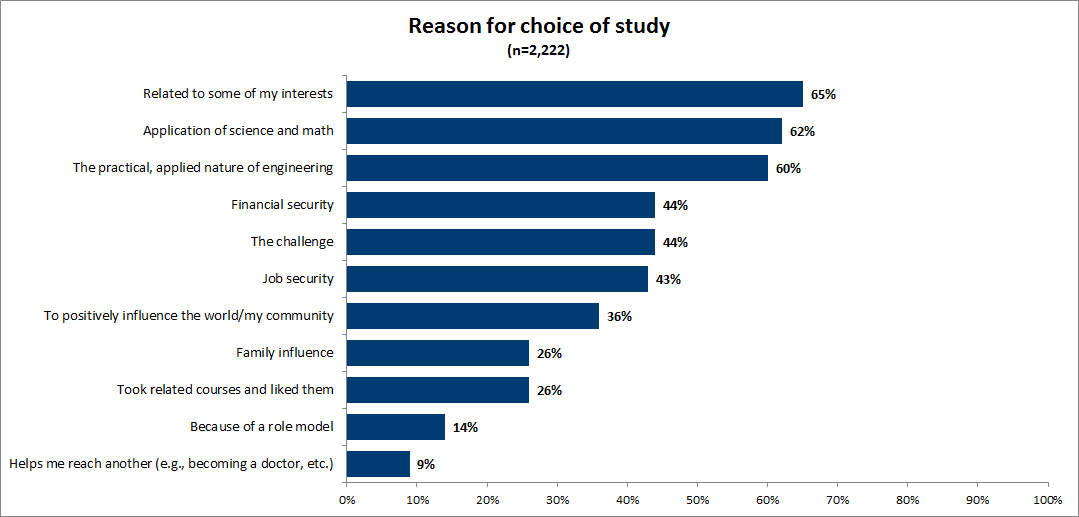
Students report many reasons for choosing to study engineering. Most commonly—as mentioned by about six in 10 each—students say they chose engineering because it is related to some of their interests, it involves the application of science and math, and they were attracted to the practical, applied nature of engineering. The choice of engineering was also about financial and job security, which is mentioned by about four in 10 students.
Experience at post-secondary
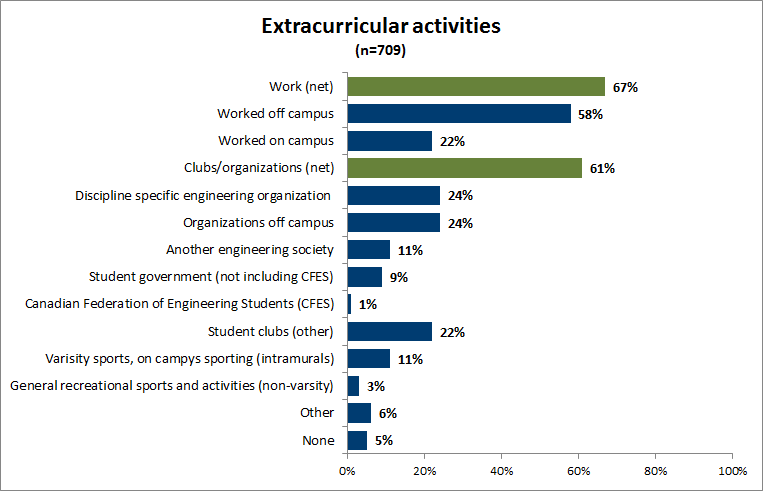
Engineering students appear to have been involved in numerous extracurricular activities. About two in three students reported that they worked either off-campus (53 per cent) or on-campus (24 per cent). About six in 10 students were involved in clubs or organizations, most often discipline-specific engineering organizations (21 per cent), other student clubs (24 per cent) or off-campus organizations (18 per cent).
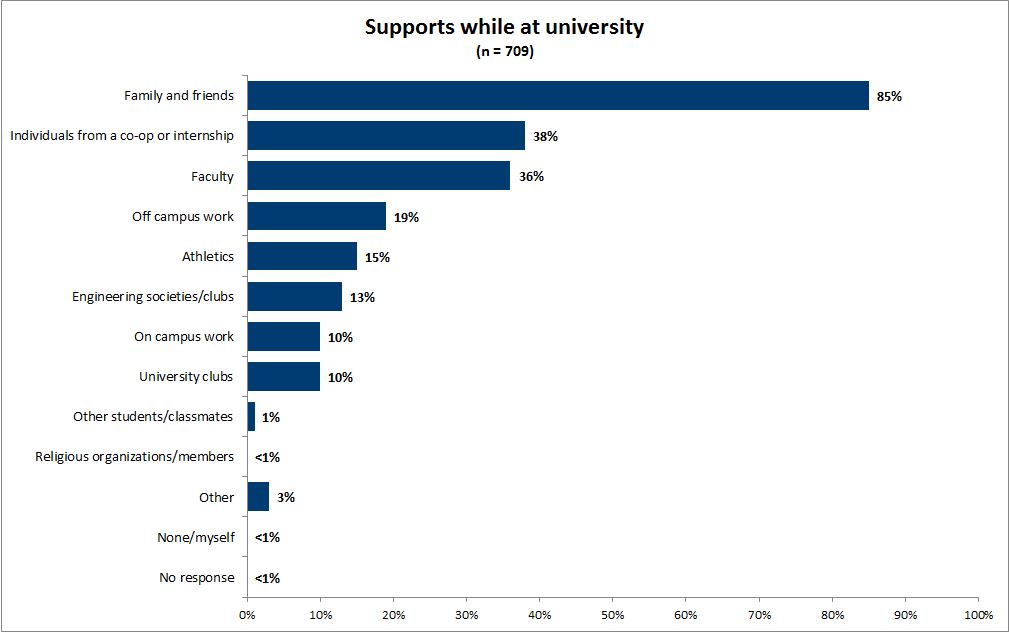
Not surprisingly, family and friends were the single most important support during students’ engineering studies, as cited by almost nine in 10 students (85 per cent). However, this was complemented by supports associated with their post-secondary. Many mentioned post-secondary faculty (36 per cent) or individuals from their co-op or internship (38 per cent) as being important supports.
According to students, the greatest barriers to completing their degree were other demands on their time. Most often, students indicated that the greatest barriers to completing their degree were maintaining a suitable school-life balance (31 per cent), managing the workload of their courses (26 per cent) or balancing school requirements while working (9 per cent). Younger students were more likely to see school-life balance and course workload as the greatest barriers, while older students were more likely to mention working and attending school simultaneously as the greatest barrier.
Plans post-graduation
Immediately after graduation, six in 10 students plan to go into the workforce, while about three in 10 students plan to travel or take a vacation (16 per cent) or pursue further education (13 per cent). The older the student, the more likely they are to report that their immediate plans are to go into the workforce; eight in 10 of those 27 years of age or older have such plans. Conversely, the youngest students (23 years of age or younger) are the most likely to plan to travel (18 per cent) or pursue more education (15 per cent).
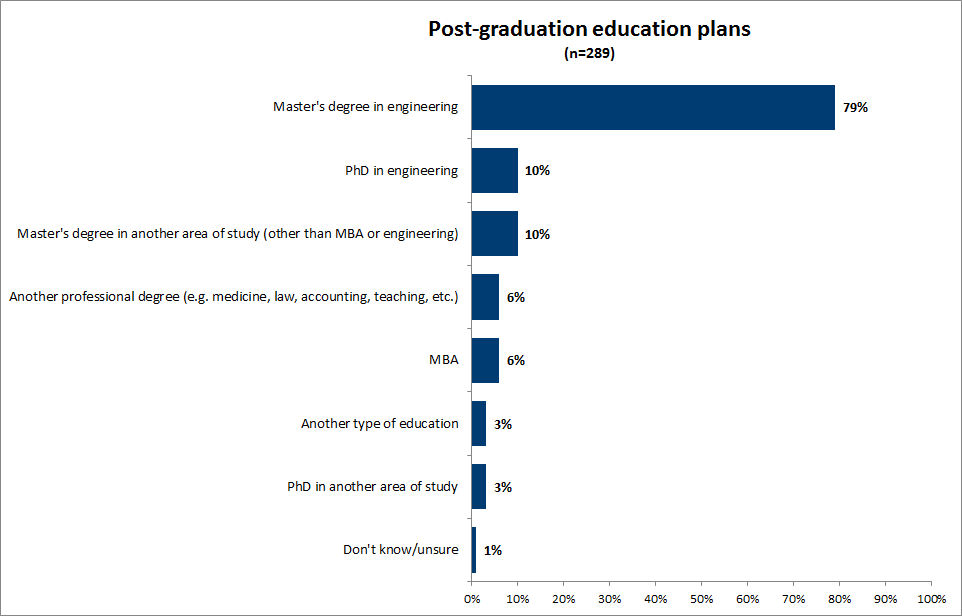
Among those planning to take more education, about nine in 10 students are planning to pursue a master’s degree or a doctorate in engineering.
Overall, about nine in 10 students indicate that they will probably or definitely be pursuing a career in engineering, although only six in 10 indicate that this is definite. The older the student, the more likely they are to say they will definitely be pursuing such a career; among those 27 years of age or older, 76 per cent said they definitely will.
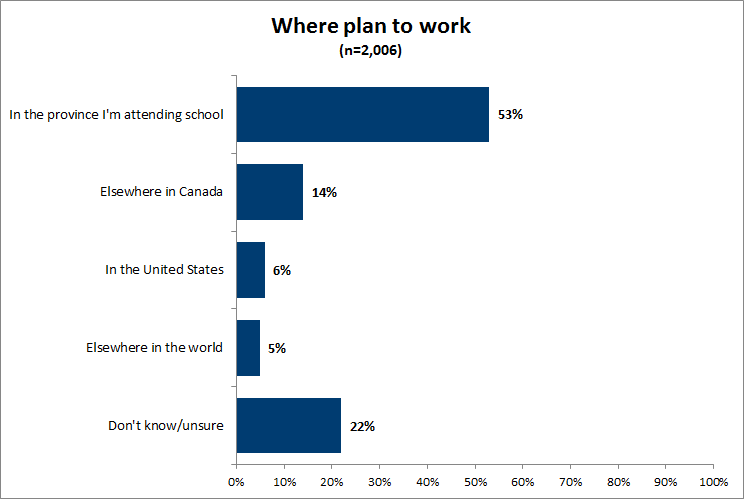
About half of the students that plan to pursue a career in engineering plan to work in the province in which they were studying. Most others simply don’t know (22 per cent), possibly because they are not sure where their career will take them. Still others report that they have plans to work in another province (14 per cent), in the United States (6 per cent), or elsewhere in the world (5 per cent). Those planning to travel (25 per cent) or pursue more education (36 per cent) immediately after graduation are less likely to know where they plan to work.
Almost four in 10 students (37 per cent) report that they have already been offered a job in the field of engineering. Those who have immediate plans to go into the workforce after graduation are the most likely (41 per cent) to report such job offers. However, even among those who plan to travel (35 per cent) or pursue more education (24 per cent), many report job offers.
Students have used many different resources to find engineering work. About six in 10 report using at least one on-campus resource, most commonly using the student career services at their post-secondary (42 per cent). About half indicate they have used mentors, such as mentors from co-op or internship experiences (39 per cent). About half also used online resources, particularly the site Indeed (18 per cent).
Those who have already received a job offer are more likely to use mentors from a co-op or internship experiences (52 per cent) as a resource than those who did not have such offers (32 per cent). Those who have not received a job offer are more likely to have used on-campus career services—whether at the post-secondary, faculty, or department level, or through websites—than those with a job offer.
Professional activity
About eight in 10 indicate that they definitely (50 per cent) or probably (29 per cent) will apply to their provincial association for licensure as a professional engineer (P.Eng.). The remaining one in five say they definitely or probably will not (13 per cent), or they are unsure (9 per cent). Older students are more likely than younger to say they definitely will apply. Surprisingly, whether or not a respondent has a job offer in the field of engineering does not appear to make any difference in plans to apply for licensure.
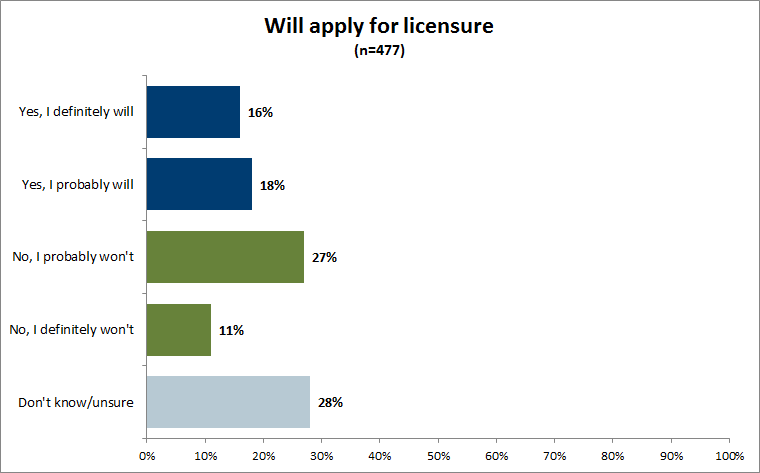
Those who were not planning to apply or were not sure if they would were informed that a licence is legally required to be able to refer to themselves as an engineer or to practice as an engineer. Knowing this, when students were asked again if they planned to apply for their P.Eng. licence, about one in three say that they will definitely (16 per cent) or probably (18 per cent) apply.
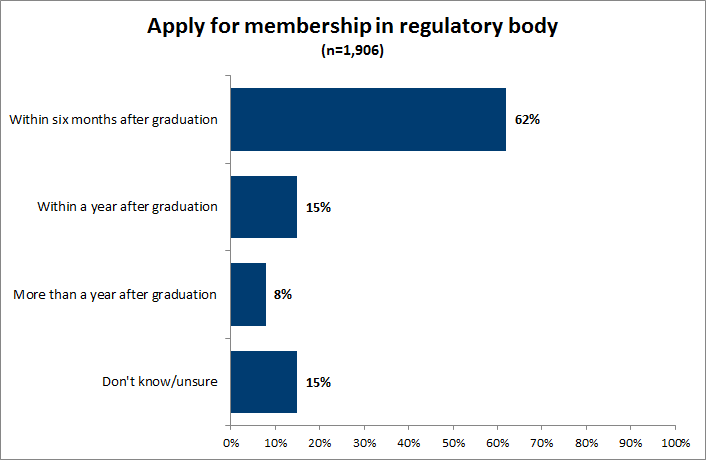
Over three in four students (77 per cent) reported that they will likely apply for membership with their regulatory body within 12 months after graduation, including 62 per cent who intend to do so within six months. Most others do not know (15 per cent) when they would apply.
The number of students reporting that they will apply within six months of graduation has been growing over time. In 2013, about four in 10 reported that they would apply in this time frame; in 2016, that number has grown to six in 10. This change is possibly the result of better communication around the benefits of applying in the first six months after graduation.
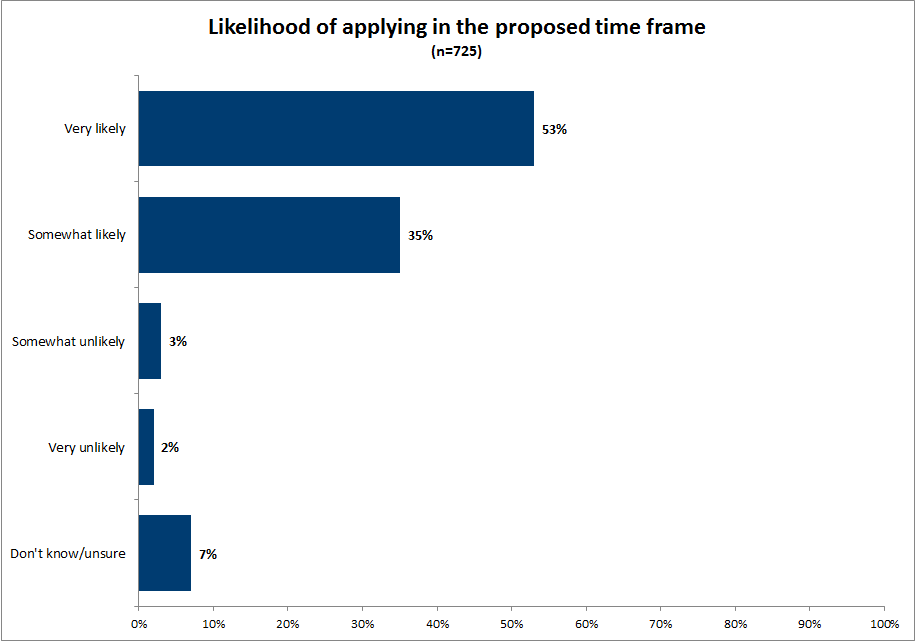
Among those who did not plan to apply within 12 months after graduation, it was explained that if they did apply within this time frame, they were eligible to have the licence application fee and first year EIT/MIT program fees waived. Knowing this, almost nine in 10 will be very (53 per cent) or somewhat (35 per cent) likely to apply for their licensure in the first six months after graduating.
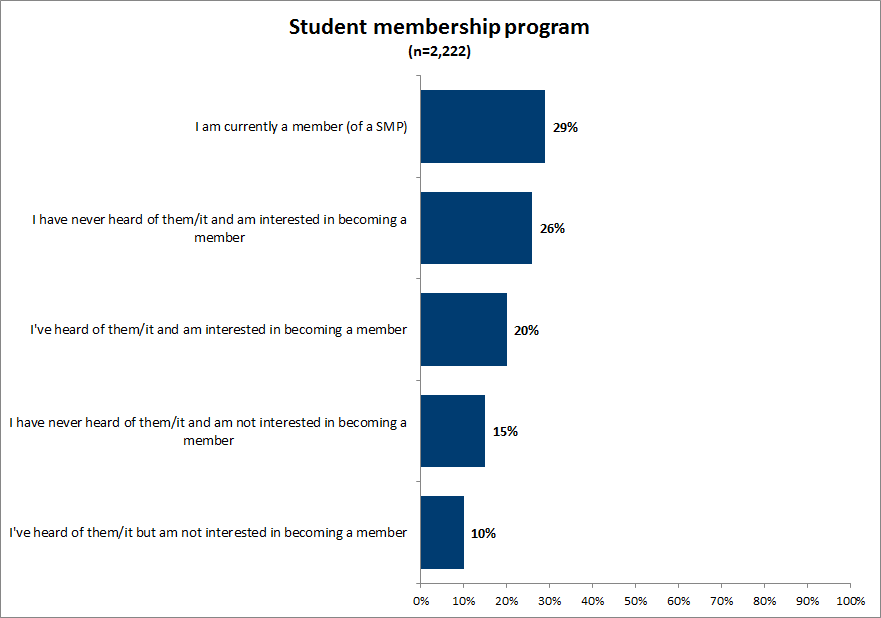
About six in 10 students report that they have heard of the Student Membership Programs (SMP), including about three in 10 who were members, one in five who were interested in becoming a member, and one in 10 who, although aware of the SMP, were not interested in becoming a member.
Understanding of licencing roles and requirements
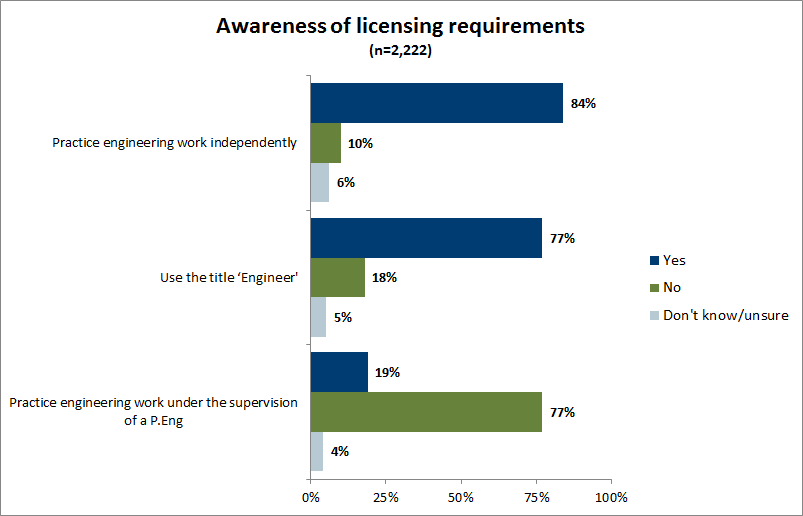
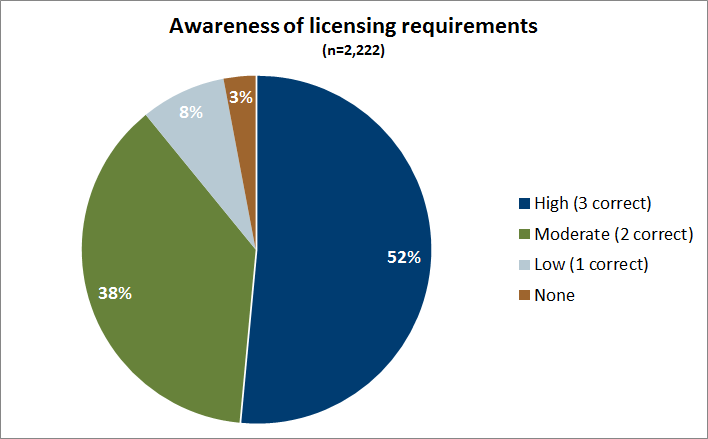
Students were asked about three activities and whether a professional engineers licence is required to do each. Overall, about half answered all three correctly. Over eight in 10 indicated that a licence was needed to practice engineering work independently. About eight in 10 correctly indicated that a licence is not needed to practice engineering work under the supervision of a P Eng. Over three in four indicated a licence was needed to use the title “Engineer.” About nine in 10 scored either high (getting all three correct, 52 per cent) or moderate (getting two correct, 38 per cent).
Licencing roles
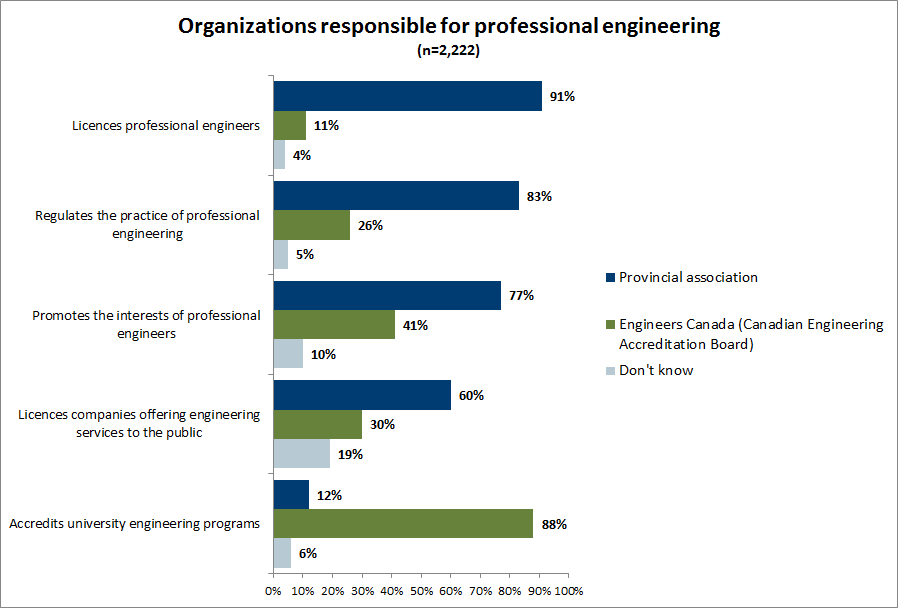
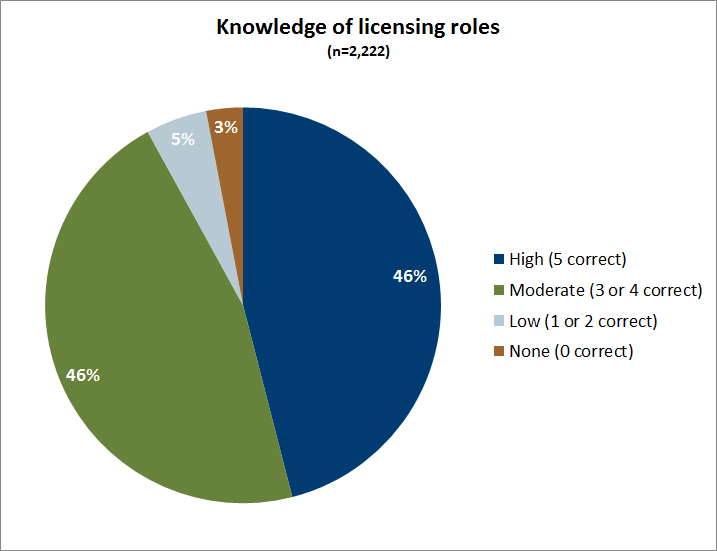
Nine in 10 students correctly believe that licencing professional engineers is the responsibility of the provincial association. Eight in 10 correctly answered that regulating the practice of professional engineering is the responsibility of the provincial association. Almost eight in 10 indicated that promoting interests of professional engineers was the responsibility of the provincial association, although four in 10 also said it is the responsibility of Engineers Canada. Thus, many see this as a dual responsibility. Six in 10 correctly indicated licencing companies offering engineering services to the public is the responsibility of the provincial association, while three in 10 mistakenly said it is Engineers Canada’s responsibility. Almost nine in 10 were correct in answering that accrediting post-secondary engineering programs is the responsibility of Engineers Canada (CEAB). Over nine in 10 scored either high (naming the organization correctly in all five cases, 46 per cent) or moderate (naming the organizations correctly in three or four of the cases, 46 per cent).
1.0 Introduction
In Canada, provincial and territorial associations regulate the practice of engineering and license members of the engineering profession. Engineers Canada is the national organization representing these associations, existing to support these provincial and territorial regulatory bodies.
Engineers Canada accredits undergraduate engineering programs, develops professional practices and qualification guidelines, and facilitates the international and interprovincial mobility of engineers. As it owns the profession’s official marks (e.g., engineer, engineering), it monitors and protects their use. Engineers Canada also promotes the profession, liaises with the federal government, develops policies and positions and undertakes media relations nationally.
1.1 Background
Engineers Canada conducts research including monitoring post-secondary institution enrolment, promoting diversity in the profession, and tracking labour market trends. One area of research is the Final Year Student Exit Survey. Engineers Canada has been conducting this survey of graduating undergraduate students since 2013.
The objective of this research is to understand the reasons why graduates of Canadian Engineering Accreditation Board-accredited engineering programs do or do not intend to apply for their licence. The research also seeks to understand the following:
- the future career and/or education plans of final year engineering students
- the motivations of students for pursing an undergraduate degree in engineering
- the proportion of graduating engineering students who intend to pursue a career in engineering
- the proportion of students who intend to apply for their P.Eng. licence once they have graduated
1.2 Methodology
1.2.1 Questionnaire design
In 2016, Engineers Canada worked with PRA to update the 2015 survey. The changes or additions to questions were translated into French by Engineers Canada. Once finalized, PRA programmed the survey into Fluid Surveys.
1.2.2 Surveying students
Approximately 46 higher education institutions’ with Accreditation Board-accredited engineering programs were invited to participate in the study and were asked to send the online survey to all final year bachelor students registered in their engineering programs. The link to the online survey was sent to the deans of faculties, and each school was requested to send the survey link to all qualified students. The survey was offered in both English and French. The online survey ran from March 9 to April 17, 2016.
Each post-secondary institution supported the study by emailing a link to qualifying students. Each post-secondary institution was responsible for managing the distribution of invitations and follow-up emails. PRA was involved in liaising with the participating post-secondary institutions, providing an online link, providing support as needed, and following up with institutions to ensure they had emailed their students.
1.2.3 Response by province
Overall, 2,222 students completed the survey, yielding a margin of error of approximately ±1.8 per cent for data presented at the national level.
| Province | # | % |
|---|---|---|
| British Columbia | 216 | 10% |
| Alberta | 398 | 18% |
| Saskatchewan | 48 | 2% |
| Manitoba | 47 | 2% |
| Ontario | 775 | 35% |
| Quebec | 530 | 24% |
| New Brunswick | 82 | 4% |
| Nova Scotia | 64 | 3% |
| Newfoundland | 62 | 3% |
| Total | 2,222 | 100% |
Note: Due to rounding, total may not sum to 100%.
1.2.4 Statistically significant differences
Large sample sizes may inflate measures of statistical significance, leading to false conclusions about the strength of association. The chi-square measure of association, in particular, is susceptible to this possibility. Therefore, the standards for designating whether a relationship can be termed statistically significant have been increased: the Pearson’s chi-square must have the probability of a type 1 error of less than 0.001. Throughout this report, we identify differences that meet this criterion.
1.2.5 Comparisons over time
Caution should be used in comparing results over time, as the institutions participating in the survey each year may have changed. In addition, question wording and response categories may have been modified over time. Therefore, it is difficult to know if any change in response is due to actual changes in the attitudes and behaviours of students, or if it is because of who participated and the wording of the question. Throughout the report, we have attempted to identify cases where wording or response categories have changed from one year to the next.
1.1 Profile of participants
The typical engineering student graduating with a bachelor’s degree is 23 years of age, male, and has a cultural background of Western European (including British).
- About seven in 10 students are 23 years of age or younger, almost two in 10 are 24 to 26, and one in 10 is 27 or older.
- Almost eight in 10 engineering students are male.
- Over six in 10 report a cultural background that is European, including British. About three in 10 report an Asian or Middle Eastern heritage.
| Age | n=2,222 |
|---|---|
| 23 or under | 72% |
| 24 to 26 | 18% |
| 27 or older | 10% |
| Average age | 23 years old |
| Male | 78% |
| Female | 22% |
Note: Due to rounding, total may not sum to 100%.
Q36C. In what year were you born?
Q36D. Are you…?
Q36E. As you know, we all live in Canada, but we come from many different ethnic backgrounds. What are your main ethnic or cultural backgrounds?
The province of permanent residence for the student sample tends to follow the population pattern for the country, with about half of the students coming from Ontario (32 per cent) or Quebec (22 per cent), about one in three coming from the west, and about one in 10 from the Atlantic provinces. More than one in 20 (6 per cent) are from outside of Canada.
The pattern is similar for the location of the institution that they are attending. As with the province of permanent residence, students are mostly attending schools in Ontario and Quebec. Almost nine in 10 (86 per cent) of these students are attending an institution in the province in which they permanently reside.
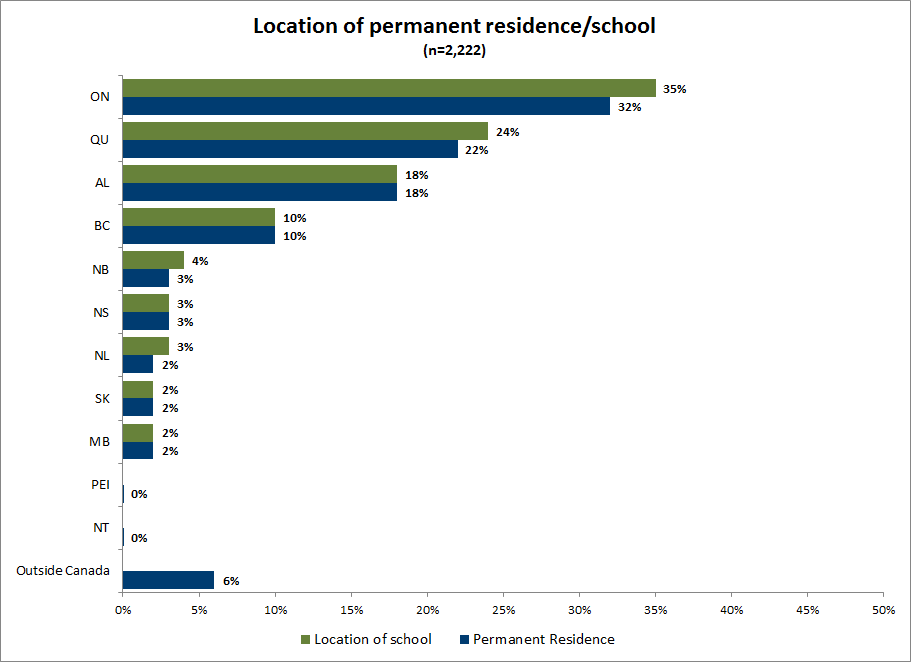
If we consider those with a permanent residence in Canada, 86 per cent are attending a school in the same province in which they permanently reside. This is similar to past surveys.
| 2013 (n=2,501) |
2014 (n=2,046) |
2015 (n=2,010) |
2016 (n=2,222) |
|
|---|---|---|---|---|
| Permanent residence of province in which attending school | 86% | 82% | 82% | 86% |
| Permanent residence of another province | 8% | 10% | 10% | 8% |
| International student | 6% | 8% | 9% | 6% |
Q35. Please select the province or territory in which you are a permanent resident.
2.0 Undergraduate motivation and experience
2.1 Knew an engineer
About half of the students report that when they were growing up, they personally knew someone who was an engineer.
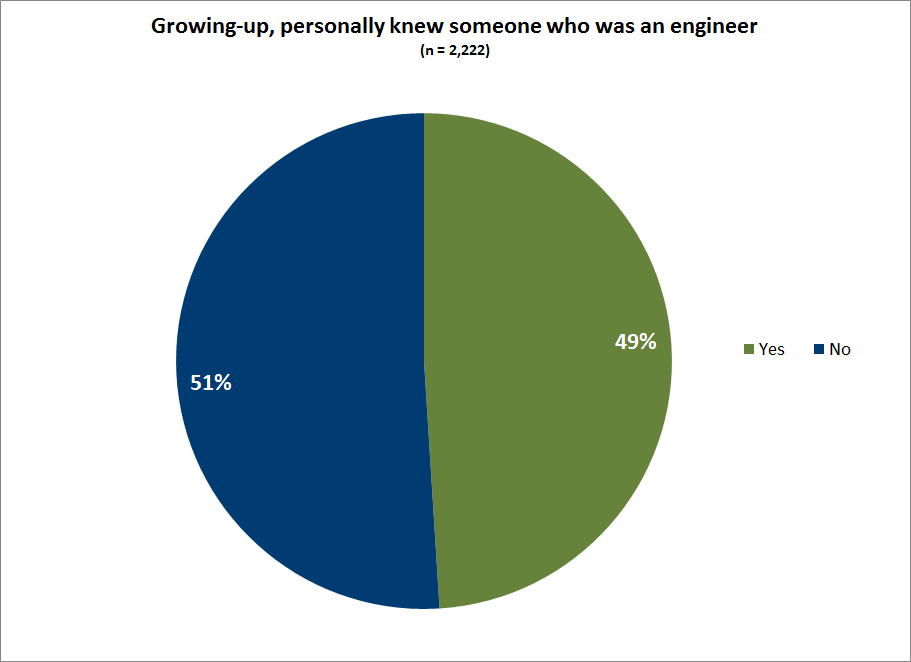
As shown in Table 4, students 23 years of age or younger are more likely than older students to report personally knowing an engineer when they were growing up.
| Gender: Male (n=1,723) |
Gender: Female (n=499) |
Age*: 23 or younger (n=1,600) |
Age*: 24 to 26 (n=405) |
Age*: 27 or older (n=217) |
|
|---|---|---|---|---|---|
| Yes | 49% | 51% | 52% | 43% | 43% |
| No | 51% | 49% | 48% | 57% | 57% |
Note: Due to rounding, columns may not sum to 100%.
2.2 Decision to pursue engineering
About two in three report that they made their decision to pursue engineering when they were in high school or before, while about one in five made the decision while in a post-secondary program or CEGEP.
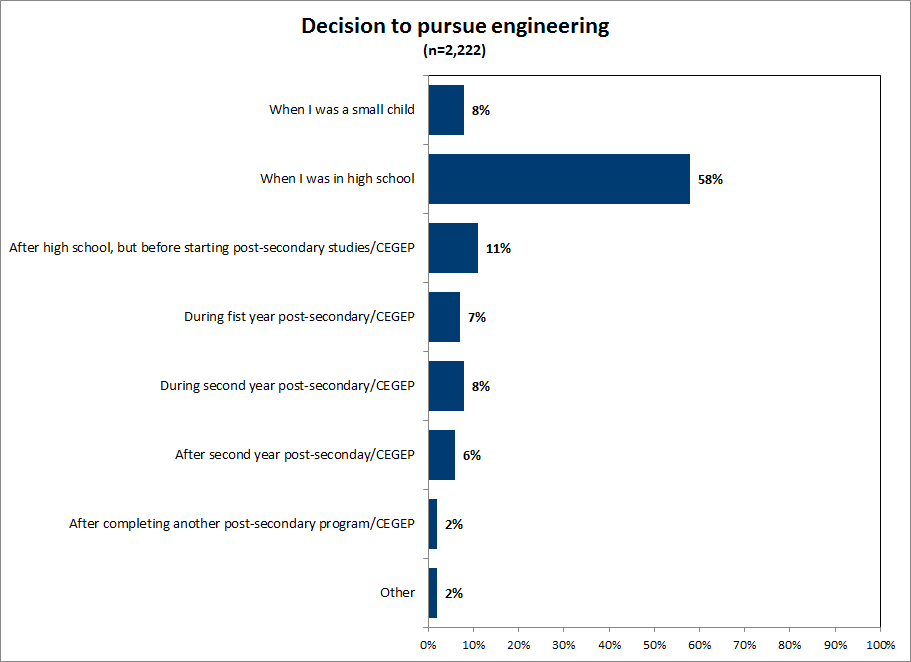
Younger students tended to have made the decision to pursue engineering earlier than older students. While about seven in 10 students 23 years of age or younger decided to pursue engineering before graduating high school, only one in five of those 27 years of age or older did the same.
| Timing | Gender: Male (n=1,723) |
Gender: Female (n=499) |
Age*23 or younger (n=1,600) |
Age*24 to 26 (n=405) |
Age*27 or older (n=217) |
|---|---|---|---|---|---|
| When I was a small child | 8% | 5% | 8% | 8% | 7% |
| While I was in high school | 57% | 61% | 69% | 35% | 20% |
| After high school, but before starting post-secondary studies/CEGEP | 11% | 9% | 9% | 15% | 13% |
| During first year of post-secondary studies/CEGEP | 7% | 9% | 6% | 11% | 8% |
| During second year of post-secondary studies/CEGEP | 7% | 9% | 6% | 13% | 7% |
| After second year of post-secondary studies/CEGEP | 6% | 5% | 2% | 14% | 17% |
| After taking/finishing another post-secondary program | 2% | 2% | <1% | 3% | 16% |
| Other | 2% | <1% | <1% | 2% | 12% |
Those who report knowing someone who was an engineer when they were growing up were more likely to make the decision to pursue engineering when they were younger. About seven in 10 of those who knew an engineer when growing up made the decision to pursue engineering while in high school or before, compared with about six in 10 of those who did not.
2.2.1 Decision to pursue, over time
As shown in Table 6, in 2016, fewer students indicate that they made the decision when they were in high school (58 per cent), compared to 2015 (70 per cent). However, this decline may reflect changes to the response categories rather than any change in behaviour. [1]
| Timing | 2015 (n=2,010) |
2016 (n=2,222) |
|---|---|---|
| When I was a small child | 9% | 8% |
| While I was in high school | 70% | 58% |
| After high school, but before starting post-secondary studies/CEGEP | n/a | 11% |
| During first year of post-secondary studies/CEGEP | 7% | 7% |
| During second year of post-secondary studies/CEGEP | 2% | 8% |
| After second year of post-secondary studies/CEGEP | 2% | 6% |
| After taking/finishing another post-secondary program | n/a | 2% |
| While working | 5% | n/a |
| Other | 6% | 2% |
Q4b. When did you make your decision to pursue engineering?
3.0 Choice of programs
3.1 Engineering discipline
The figure below shows the disciplines reported by students. The top four (civil, electrical, bio-systems, and mechanical) represent 63 per cent of all responses.
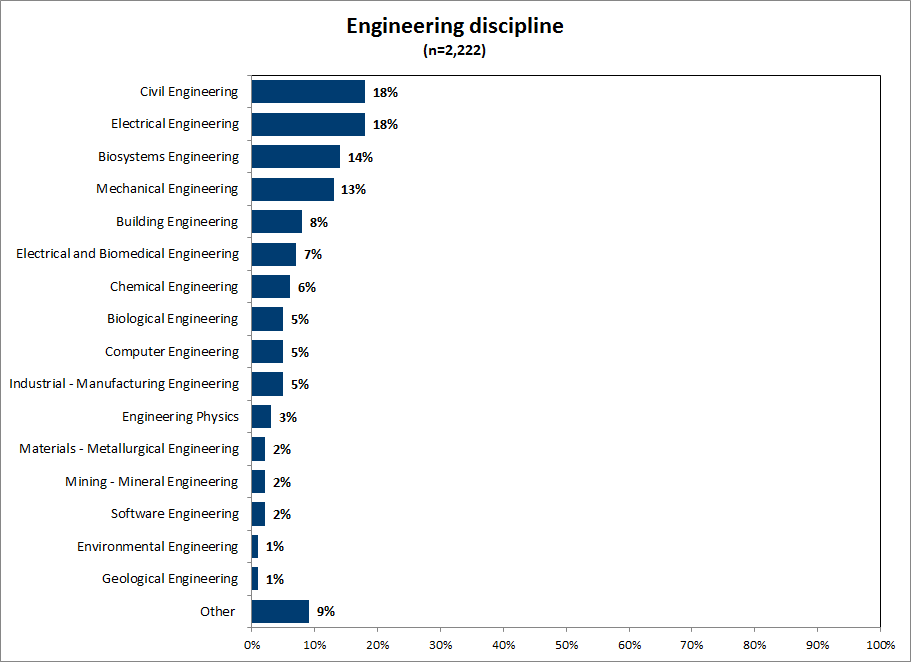
3.1.1 Engineering discipline, over time
The dramatic change in which engineering discipline students were studying may be due to the post-secondary institutions that participated in the 2016 survey, compared to previous years, or the introduction of new programs graduating the first cohort of students. Prior to 2016, mechanical engineering topped the list, but now electrical and civil engineering are the most common. Bio-systems, which 14 per cent of students list as their engineering discipline, did not make the list prior to 2016.
| Over time | 2013 (n=2,501) |
2014 (n=2,046) |
2015 (n=2,010) |
2016 (n=2,222) |
|---|---|---|---|---|
| Mechanical engineering | 22% | 20% | 21% | 13% |
| Electrical engineering | 15% | 13% | 14% | 18% |
| Civil engineering | 18% | 17% | 17% | 18% |
| Chemical engineering | 8% | 10% | 7% | 6% |
| Computer engineering | 4% | 4% | 6% | 5% |
| Software engineering | 4% | 4% | 4% | 2% |
Q3. Please indicate the engineering discipline in which you are currently studying by selecting one of the following options.
3.2 Choice of engineering discipline
Students provide many reasons why they chose to study engineering. The most common—each mentioned by six in 10 respondents—were the following:
- It is related to some of their interests.
- It involved the application of science and math.
- They were attracted to the practical, applied nature of engineering.
Other commonly mentioned reasons—each mentioned by at least four in 10 respondents—were financial security, job security, or the challenge of engineering.
The reasons for pursuing a particular engineering discipline do not appear to be related to gender or age, as the top reasons provided by students are the same regardless: engineering related to some of their interests, the application of science and math, and the practical, applied nature of engineering. That being said, the results suggest that younger respondents (23 or younger) are more reliant on family influence for their choice than those in the oldest age cohort (27 and older).
| Gender: Male (n=1,723) |
Gender: Female (n=499) |
Age: 23 or younger (n=1,600) |
Age: 24 to 26 (n=405) |
Age: 27 or older (n=217) |
|
| Related to some of my interests | 66% | 62% | 66% | 64% | 59% |
| Application of science and math | 60% | 68% | 67% | 49% | 50% |
| The practical, applied nature of engineering | 62% | 53% | 60% | 60% | 56% |
| Financial security | 44% | 40% | 44% | 39% | 47% |
| The challenge | 44% | 45% | 44% | 41% | 51% |
| Job security | 42% | 45% | 44% | 38% | 42% |
| To positively influence the world/my community | 34% | 40% | 36% | 33% | 34% |
| Family influence | 24% | 32% | 28% | 22% | 18% |
| Took related courses and liked them | 27% | 25% | 28% | 23% | 17% |
| Because of a role model | 13% | 16% | 15% | 10% | 12% |
| Helps me reach another (e.g., becoming a doctor) | 9% | 8% | 8% | 9% | 12% |
| Other | 3% | 3% | 3% | 3% | 7% |
Q4a. Thinking back to when you decided to pursue engineering, what were the main reasons you chose to study this discipline?
Note: Respondents could choose more than one response. Columns may sum to more than 100%.
3.2.1 Reason for choice, over time
Reasons given by respondents have not changed significantly from the last survey, as shown in Error! Reference source not found. below.
| Reason | 2015 (n=2,010) |
2016 (n=2,222) |
|---|---|---|
| Related to some of my interests | 65% | 65% |
| Application of science and math | 63% | 62% |
| The practical, applied nature of engineering | 56% | 60% |
| Financial security | 42% | 44% |
| The challenge | 41% | 44% |
| Job security | 41% | 43% |
| To positively influence the world/my community | 34% | 36% |
| Family influence | 29% | 26% |
| Took related courses and liked them | 25% | 26% |
| Because of a role model | 15% | 14% |
| Helps me reach another (e.g., becoming a doctor) | 9% | 9% |
| Other | 4% | 3% |
Q4a. Thinking back to when you decided to pursue engineering, what were the main reasons you chose to study this discipline?
Note: Respondents could choose more than one response. Columns may add to more than 100%.
4.0 Experience while at post-secondary institution
4.1 Extracurricular activities
Students were asked if they participated in any of 10 extracurricular activities during their degree program. Almost all report participating in at least one of them.
- About two in three students report that they worked either off campus (53 per cent) or on campus (24 per cent).
- About six in 10 were involved in clubs or organizations, most often discipline-specific engineering organizations (21 per cent) such as the Geological Engineering Club or the Mechanical Engineering Association, other student clubs (24 per cent) or off-campus organizations (18 per cent).
Female students appear to have been more involved than their male counterparts in almost all organizations and clubs, including discipline-specific engineering organizations. Female students are also more likely to have worked on campus.
The older the student, the less likely he/she was to be involved on campus, including working on campus, and participating in various organizations (e.g., student clubs) and varsity sports.
| Gender: Male (n=1,723) |
Gender: Female (n=499) |
Age: 23 or younger (n=1,600) |
Age: 24 to 26 (n=405) |
Age: 27 or older (n=217) |
|
|---|---|---|---|---|---|
| Work | |||||
| Worked off campus | 54% | 49% | 51% | 58% | 56% |
| Worked on campus | 22% | 31% | 25% | 24% | 18% |
| Organizations/clubs | |||||
| Discipline-specific engineering organization | 19% | 30% | 23% | 16% | 18% |
| Organizations off campus | 17% | 23% | 19% | 17% | 15% |
| Another engineering society | 10% | 16% | 12% | 7% | 11% |
| Student government (not including CFES) | 8% | 13% | 11% | 6% | 6% |
| Canadian Federation of Engineering Students (CFES) | 1% | 3% | 2% | 1% | 1% |
| Student clubs (other) | 22% | 34% | 27% | 22% | 11% |
| Other | |||||
| Varsity sports, on-campus sporting (intramurals) | 13% | 13% | 14% | 12% | 7% |
| General recreational sports and activities, non-varsity | 3% | 3% | 3% | 1% | 2% |
| Other | 8% | 7% | 7% | 7% | 12% |
| None | 6% | 2% | 5% | 5% | 7% |
| No response | <1% | - | <1% | - | - |
Q4D. Did you participate in any of the following extracurricular activities during your degree program?
Note: Respondents could choose more than one response. Columns may sum to more than 100%.?
4.1.1 Extracurricular activities, over time
The type of extracurricular activities cited by students in 2016 is almost identical to those identified last year.
| Extracurricular activities | Over time | |
|---|---|---|
| Work | 2015 (n=2,010) |
2016 (n=2,222) |
| Worked off campus | 52% | 53% |
| Worked on campus | 27% | 24% |
| Organizations/clubs | ||
| Discipline-specific engineering organization | 23% | 21% |
| Organizations off campus | 23% | 18% |
| Engineering society | 13% | 11% |
| Student government (not including CFES) | 11% | 9% |
| Canadian Federation of Engineering Students (CFES) | 2% | 2% |
| Student clubs (other) | 28% | 24% |
| Other | ||
| Varsity sports, on-campus sporting (intramurals) | 11% | 13% |
| General recreational sports and activities, non-varsity | - | 3% |
| Other | 17% | 7% |
| No extracurricular activities | ||
| None | - | 5% |
| No response | - | <1% |
Q4D. Did you participate in any of the following extracurricular activities during your degree program?
Note: Respondents could choose more than one response. Columns may sum to more than 100%.?
4.2 Supports while at post-secondary institution
Family and friends were the single most important support during students’ engineering studies, as cited by almost nine in 10 respondents (85 per cent). This is complemented by the fact that almost three in four mention post-secondary institution supports either directly (faculty: 36 per cent) or indirectly (individuals from their co-op or internship: 38 per cent).
Both men and women relied on similar supports during their engineering studies. While all age groups most often cite family and friends as the supports that were most important to them, the oldest age cohort was more likely to rely on off-campus work, and less likely to rely on on-campus activities such as athletics, engineering societies/clubs, or post-secondary institution clubs than their younger cohorts.
| Supports | Gender: Male (n=1,723) |
Gender: Female (n=499) |
Age: 23 or younger (n=1,600) |
Age: 24 to 26 (n=405) |
Age: 27 or older (n=217) |
|---|---|---|---|---|---|
| Family and friends | 84% | 88% | 86% | 81% | 83% |
| Individuals from a co-op or internship | 38% | 37% | 38% | 41% | 30% |
| Faculty | 36% | 37% | 35% | 38% | 40% |
| Off-campus work | 21% | 13% | 17% | 22% | 29% |
| Athletics | 16% | 13% | 17% | 13% | 10% |
| Engineering societies/clubs | 12% | 18% | 15% | 11% | 7% |
| On-campus work | 11% | 9% | 10% | 10% | 13% |
| Post-secondary institution clubs | 10% | 12% | 11% | 9% | 5% |
| Other students/classmates | 1% | 1% | 1% | 1% | 3% |
| Religious organizations/members | <1% | - | <1% | 1% | - |
| Other | 3% | 2% | 2% | 3% | 5% |
| None/myself | <1% | - | <1% | <1% | 1% |
| No response | <1% | - | <1% | - | - |
Q4C. Thinking of all the supports you had during your engineering studies, which of the following have been the most important to you?
Note: Respondents could choose more than one response. Columns may sum to more than 100%.
While the oldest age cohort is just as likely as their younger counterparts to have had off-campus work, they are more likely than younger respondents to report this as important. Although the oldest cohort is slightly less likely to have had on-campus work, they are just as likely as younger students to report it as important.
4.2.1 Supports, over time
This year’s findings are almost identical to the 2015 results.
| Supports | 2015 (n=2,010) |
2016 (n=2,222) |
|---|---|---|
| Family and friends | 86% | 85% |
| Individuals from a co-op or internship | 34% | 38% |
| Faculty | 36% | 36% |
| Off-campus work | 14% | 19% |
| Athletics | 11% | 15% |
| Engineering societies/clubs | 13% | 13% |
| On-campus work | 8% | 10% |
| Post-secondary institution clubs | 9% | 10% |
| Other | 5% | 3% |
Q4C. Thinking of all the supports you had during your engineering studies, which of the following have been the most important to you?
Note: Respondents could choose more than one response. Columns may add to more than 100%.?
4.3 Barriers to completing degree
Almost three in four students indicate that the greatest barrier to completing their degree was other demands on their time, including maintaining a suitable school-life balance (31 per cent), managing the workload of their courses (26 per cent) or balancing school requirements while working (9 per cent).
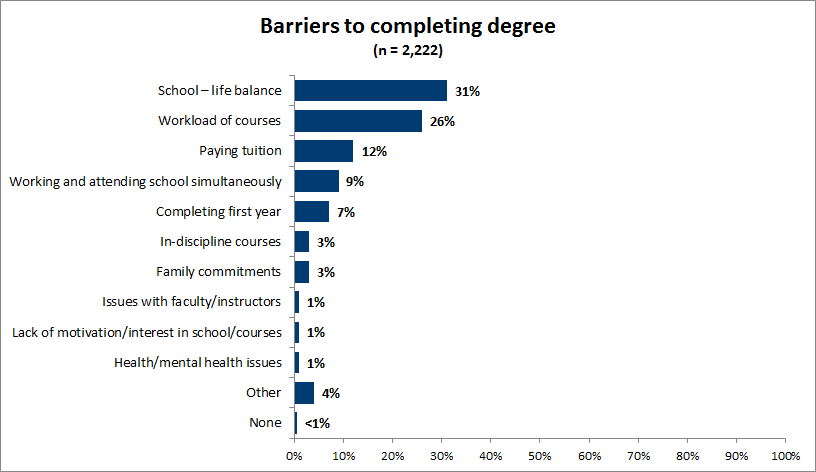
The youngest age cohort is more likely than the oldest to site school-life balance and the workload of courses as the greatest barriers. While the oldest age cohort also cites these barriers, they were more likely than the youngest cohort to mention working and attending school simultaneously and family commitments as having been their single greatest barrier to completing their degree.
| Barrier | Gender: Male (n=1,723) |
Gender: Female (n=499) |
Age*: 23 or younger (n=1,600) |
Age*: 24 to 26 (n=405) |
Age*: 27 or older (n=217) |
|---|---|---|---|---|---|
| School-life balance | 31% | 32% | 34% | 29% | 20% |
| Workload of courses | 26% | 29% | 29% | 21% | 17% |
| Paying tuition | 12% | 11% | 12% | 12% | 15% |
| Working and attending school simultaneously | 9% | 10% | 6% | 16% | 22% |
| Completing first year | 7% | 7% | 7% | 8% | 6% |
| In-discipline courses | 4% | 3% | 3% | 4% | 3% |
| Family commitments | 3% | 2% | 1% | 2% | 12% |
| Other | 5% | 2% | 4% | 5% | 5% |
| None | <1% | <1% | 1% | - | - |
Q4E. Considering all of your experiences in studying for your engineering discipline, what has been the single greatest barrier to completing your degree?
Note: Due to rounding, columns may not sum to 100%.* Statistical significant difference. Chi sq. p=.000?
4.3.1 Barriers, over time
Compared to 2015, this year’s results are almost identical.
| Barrier | 2015 (n=2,010) |
2016 (n=2,222) |
|---|---|---|
| School-life balance | 30% | 31% |
| Workload of courses | 32% | 26% |
| Paying tuition | 12% | 12% |
| Working and attending school simultaneously | 7% | 9% |
| Completing first year | 6% | 7% |
| In-discipline courses | 4% | 3% |
| Family commitments | 2% | 3% |
| Other | 8% | 4% |
| None | - | <1% |
Q4E. Considering all of your experiences in studying for your engineering discipline, what has been the single greatest barrier to completing your degree?
Note: Due to rounding, columns may not sum to 100%.
5.0 Plans post-graduation
About six in 10 students plan to go into the workforce immediately after they graduate. Others plan to travel or go on vacation (16 per cent) or pursue more education (13 per cent).
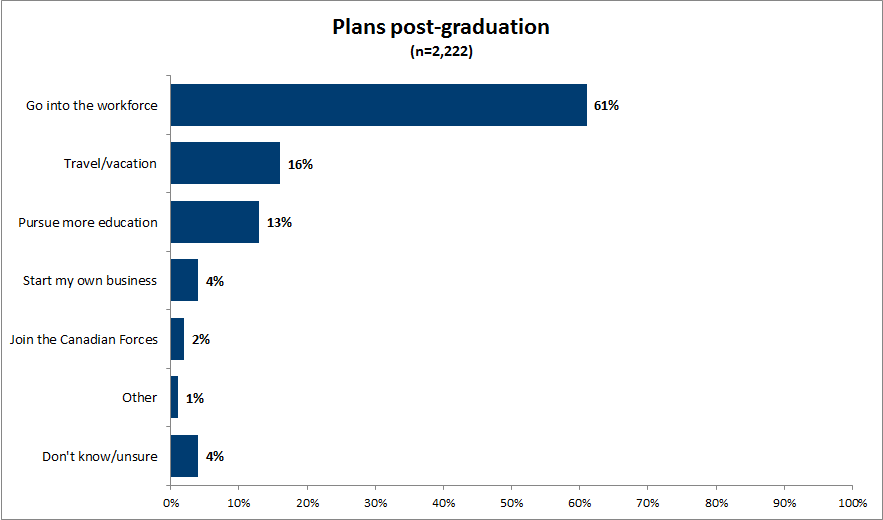
Reported plans immediately after graduation vary by gender and age. Female students are more likely than their male counterparts to plan to travel or vacation immediately after graduation, while male students are more likely than female students to go into the work force, start their own business or join the Canadian Forces.
While a majority of all age groups plan to immediately go into the workforce after they graduate, older students are more likely than younger students to report this plan. For example, eight in 10 of those 27 years of age or older plan to go immediately into the workforce, compared with six in 10 of those 23 or younger. Conversely, younger students are more likely to report they will travel or vacation or—in the case of the youngest age cohort—pursue more education.
| Plans | Gender: Male (n=1,723) |
Gender: Female (n=499) |
Age*: 23 or younger (n=1,600) |
Age*: 24 to 26 (n=405) |
Age*: 27 or older (n=217) |
|---|---|---|---|---|---|
| Go into the workforce | 62% | 57% | 57% | 66% | 80% |
| Travel/vacation | 14% | 22% | 18% | 15% | 4% |
| Pursue more education | 13% | 14% | 15% | 8% | 7% |
| Start my own business | 5% | 1% | 3% | 7% | 3% |
| Join the Canadian Forces | 2% | 1% | 2% | 1% | 3% |
| Other | 1% | 1% | 1% | - | 1% |
| Don't know/unsure | 4% | 4% | 5% | 3% | 2% |
Q12. Which of the following best describes your plans for immediately after you graduate?
Note: Due to rounding, columns may not sum to 100%..
* Statistical significant difference. Chi sq. p=.000
5.1.1 Immediate plans, over time
In 2016, the question was reworded and the response categories expanded. As a result, while their short-term plans may still involve going into the workforce, fewer students indicate that this is their immediate plan in 2016.
| Plans | 2013 (n=2,501) |
2014 (n=2,046) |
2015 (n=2,010) |
2016 (n=2,222) |
|---|---|---|---|---|
| Go into the workforce | 78% | 75% | 76% | 61% |
| Travel/vacation | n/a | n/a | n/a | 16% |
| Pursue more education | 16% | 17% | 16% | 13% |
| Start my own business | n/a | n/a | n/a | 4% |
| Join the Canadian Forces | n/a | n/a | n/a | 2% |
| Other | n/a | n/a | n/a | 1% |
| Don't know/unsure | 4% | 5% | 6% | 4% |
Q12. Which of the following best describes your plans for immediately after you graduate?
Note: Prior to 2016, the question read: Which of the following best describes your current plans after you graduate?, and the response categories did not include Travel/Vacation. Due to rounding, columns may not sum to 100%?
5.2 Post-graduation education plans
Of the 13 per cent who report plans to further their education immediately after graduation, about nine in 10 plan to pursue either a master’s (79 per cent) or doctorate (10 per cent) degree in engineering. However, about one in four also report that they plan on pursuing non-engineering-related education, most often an MBA (6 per cent), a master’s degree in another discipline (10 per cent) or another professional degree (6 per cent).
5.2.1 Education plans, over time
While results are similar, more students plan to pursue a master’s degree in engineering in 2016 than was reported in 2015. This difference may be due to the exclusion of those in 2016 whose immediate plan was to travel, but whose longer term plan may have been to go back to school.
| Education plans | 2015* (n=307) |
2016 (n=289) |
|---|---|---|
| Pursue a master's degree in engineering | 66% | 79% |
| Pursue a master's degree in another area of study (other than MBA or engineering) | 9% | 10% |
| Pursue a PhD in engineering | 7% | 10% |
| Pursue an MBA | 2% | 6% |
| Pursue another professional degree (e.g., medicine, law, accounting, teaching) | 7% | 6% |
| Pursue a PhD in another area of study | 1% | 3% |
| Pursue another type of education* | 2% | 3% |
| Don't know/unsure | 6% | 1% |
Q13. Which of the following best describes the education you plan to pursue?
Note: Respondents could choose more than one response. Columns may not sum to 100%.
* In 2015, the response category read: Pursue a graduate degree in another area of study.
5.3 Pursue a career in the field of engineering
All students were asked if they plan to pursue a career in engineering once they complete their education. About nine in 10 say they definitely (60 per cent) or probably (30 per cent) will. Conversely, about one in 10 either indicate they probably (3 per cent) or definitely (2 per cent) will not or do not know for sure (5 per cent).
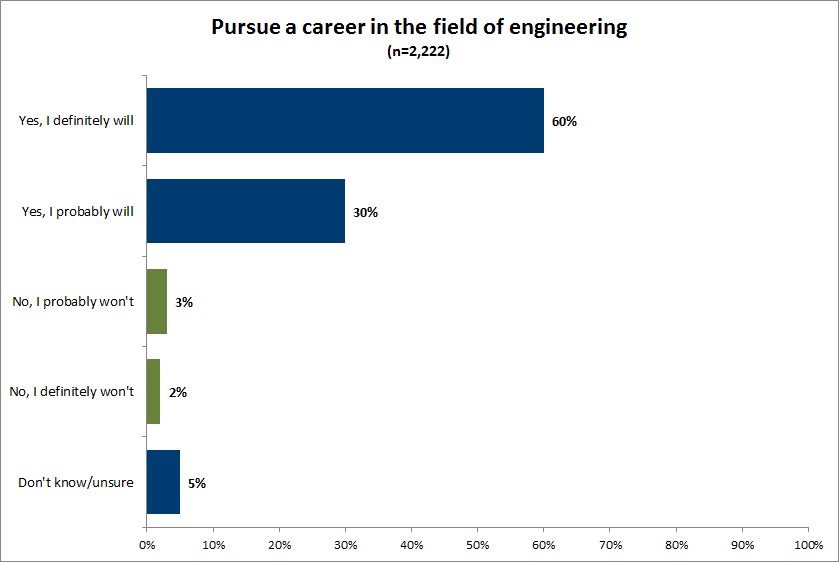
Older students are more likely to indicate that they will definitely pursue a career in the field of engineering. Over three in four of those 27 or older indicate they will definitely pursue a career in the engineering field, compared with fewer than six in 10 of those 23 or younger.
| Gender: Male (n=1,723) |
Gender: Female (n=499) |
Age*: 23 or younger (n=1,600) |
Age*: 24 to 26 (n=405) |
Age*: 27 or older (n=217) |
|
|---|---|---|---|---|---|
| Yes, I definitely will | 62% | 54% | 58% | 64% | 76% |
| Yes, I probably will | 29% | 36% | 33% | 28% | 18% |
| No, I probably won't | 3% | 4% | 4% | 3% | 2% |
| No, I definitely won't | 2% | 1% | 2% | 2% | - |
| Don't know/unsure | 5% | 6% | 5% | 4% | 4% |
Q14. When you complete your education, do you plan to pursue a career in the engineering field?
Note: Due to rounding, columns may not sum to 100%..
* Statistical significant difference. Chi sq. p=.000
Regardless of their plans immediately after graduation, most students report that they will definitely or probably pursue a career in the engineering field. However, those who plan to go into the workforce immediately after completing their education are more likely to say they will definitely do so (68 per cent), compared with those who are planning to travel (52 per cent) or take more education (54 per cent).
| Plans immediately after graduation* | |||
|---|---|---|---|
| Go into the workforce (n=1,350) | Travel/ vacation (n=360) |
More education (n=289) |
|
| Yes, I definitely will | 68% | 52% | 54% |
| Yes, I probably will | 26% | 36% | 34% |
| No, I probably won't | 2% | 4% | 4% |
| No, I definitely won't | 1% | 2% | 2% |
| Don't know/unsure | 3% | 6% | 6% |
Q14. When you complete your education, do you plan to pursue a career in the engineering field?
Note: Due to rounding, columns may not sum to 100%
* Statistical significant difference. Chi sq. p=.000
5.3.1 Career in engineering, over time
Over time, graduates appear to have similar plans, with nine in 10 reporting that they will definitely or probably pursue a career in the engineering field.
| 2013 (n=2,501) |
2014 (n=2,046) |
2015 (n=2,010) |
2016 (n=2,222) |
|
|---|---|---|---|---|
| Yes, I definitely will | 65% | 61% | 58% | 60% |
| Yes, I probably will | 30% | 31% | 32% | 30% |
| No, I probably won't | 4% | 6% | 5% | 3% |
| No, I definitely won't | 1% | 1% | 1% | 2% |
| Don't know/unsure | - | 5% | 4% | 5% |
Q14. When you complete your education, do you plan to pursue a career in the engineering field?
Note: Due to rounding, columns may not sum to 100%.?
5.4 Where they plan to work
Among those who plan to work in the engineering field, about two in three students plan to work in Canada, either in the province where they attend school (53 per cent) or elsewhere in the country (14 per cent). About one in 10 plan to work outside Canada, either in the United States (6 per cent) or some other part of the world (5 per cent). About one in five do not have definite plans as to where they will work.
Those 27 years of age or older are more likely to know where they plan to work than their younger cohorts. Almost nine in 10 of those in the oldest age cohort report that they know where they plan to work, including 65 per cent who report that they plan to work in the province in which they are attending school.
Conversely, only three in four of the youngest age cohort know where they plan to work, including half who plan to work in the province in which they are attending school. Indeed, among this age cohort, one in four simply do not know where they plan to work.
| Gender: Male (n=1,723) |
Gender: Female (n=499) |
Age*: 23 or younger (n=1,600) |
Age*: 24 to 26 (n=405) |
Age*: 27 or older (n=217) |
|
|---|---|---|---|---|---|
| In the province I'm attending school | 53% | 51% | 50% | 58% | 65% |
| Elsewhere in Canada | 14% | 15% | 15% | 11% | 14% |
| In the United States | 6% | 5% | 7% | 3% | 4% |
| Elsewhere in the world | 5% | 6% | 5% | 8% | 4% |
| Don't know/unsure | 22% | 23% | 24% | 21% | 13% |
Q17D. Where do you plan to work?
Note: Due to rounding, columns may not sum to 100%..
* Statistical significant difference. Chi sq. p=.000
Those planning to immediately go into the workforce are also the most likely to indicate that they plan to work in the province where they are attending school. They are also the group that is most likely to know where they plan to work (84 per cent could name a location). Among those planning more education, they are the least likely to be able to name a location where they plan to work (64 per cent). However, they are the most likely of these three groups to say they plan to work elsewhere in the world (9 per cent).
| Go into the workforce (n=1,275) | Travel/ vacation (n=315) |
More education (n=254) |
|
|---|---|---|---|
| In the province I'm attending school | 60% | 50% | 37% |
| Elsewhere in Canada | 15% | 11% | 9% |
| In the United States | 5% | 9% | 9% |
| Elsewhere in the world | 4% | 6% | 9% |
| Don't know/unsure | 16% | 25% | 36% |
Q17D. Where do you plan to work?
Note: Due to rounding, columns may not sum to 100%
* Statistical significant difference. Chi sq. p=.000
5.4.1 Where they plan to work, over time
Compared to 2015, little has changed in regards to where respondents plan to work once they graduate.
| Location | 2015* (n=2,048) |
2016 (n=2,006) |
|---|---|---|
| In the province I'm attending school | 49% | 53% |
| Elsewhere in Canada | 16% | 14% |
| In the United States | 6% | 6% |
| Elsewhere in the world | 7% | 5% |
| Don't know/unsure | 22% | 22% |
Q17D. Where do you plan to work?
Note: Due to rounding, columns may not sum to 100% ?
5.5 Not planning a career in engineering
5.5.5 Reasons for not pursuing a career in engineering
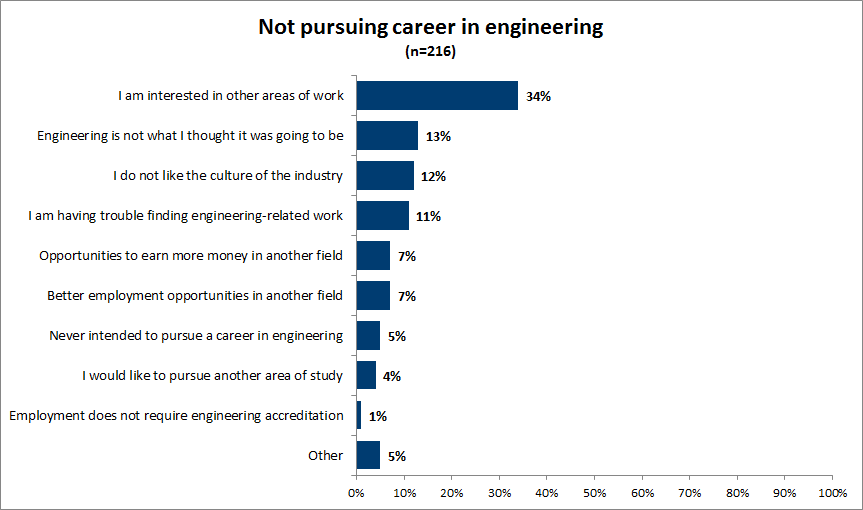
The 10 per cent of respondents who indicated that they probably or definitely would not pursue a career in engineering, or were not sure, were asked for a reason.
Most commonly, they report that they are simply interested in other areas of work (34 per cent), they never intended to pursue a career in engineering (5 per cent), or they want to pursue other areas of study (4 per cent).
Some did not like engineering, saying it was not what they thought it would be (13 per cent) or that they did not like the engineering culture (12 per cent).
Others say that they cannot find work in engineering (11 per cent), they have opportunities to earn more money in other fields (7 per cent), or they have better employment opportunities in other fields (7 per cent).
5.5.2 Over time
In 2016, the reasons for not pursuing a career in engineering were expanded, so it is very difficult to make comparison over time.
| Reasons | 2013 (n=135) |
2014 (n=146) |
2015 (n=118) |
2016 (n=216) |
|---|---|---|---|---|
| I am interested in other areas of work | 7% | 7% | 12% | 34% |
| Engineering is not what I thought it was going to be | 27% | 38% | 31% | 13% |
| I do not like the culture of the industry | n/a | n/a | 3% | 12% |
| I am having trouble finding engineering-related work | n/a | n/a | 4% | 11% |
| Opportunities to earn more money in another field | 13% | 10% | 6% | 7% |
| Better employment opportunities in another field | 20% | 17% | 14% | 7% |
| Never intended to pursue a career in engineering | 16% | 12% | 18% | 5% |
| I would like to pursue another area of study | n/a | n/a | n/a | 4% |
| Employment does not require engineering degree | n/a | n/a | n/a | 1% |
| Other | 7% | 8% | 9% | 5% |
Q16. What is the primary reason you decided to pursue a career outside of engineering?
Note: Due to rounding, columns may not sum to 100%.?
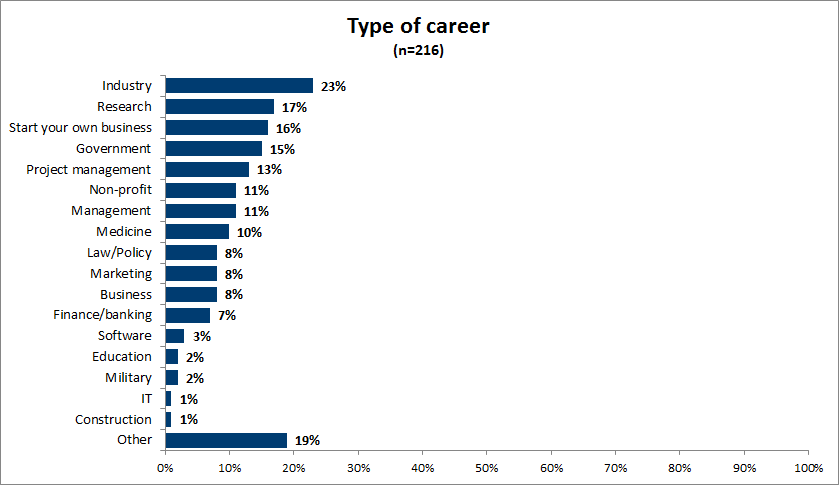
5.5.3 Type of career
Those who do not plan to pursue a career in engineering were asked in what area they planned to work. The figure below shows the type of career they plan to pursue.
Most commonly, these students plan to work in industry (23 per cent), research (17 per cent), their own business (16 per cent), government (15 per cent) or project management (13 per cent). These response categories are not mutually exclusive, and respondents often chose more than one.[1]
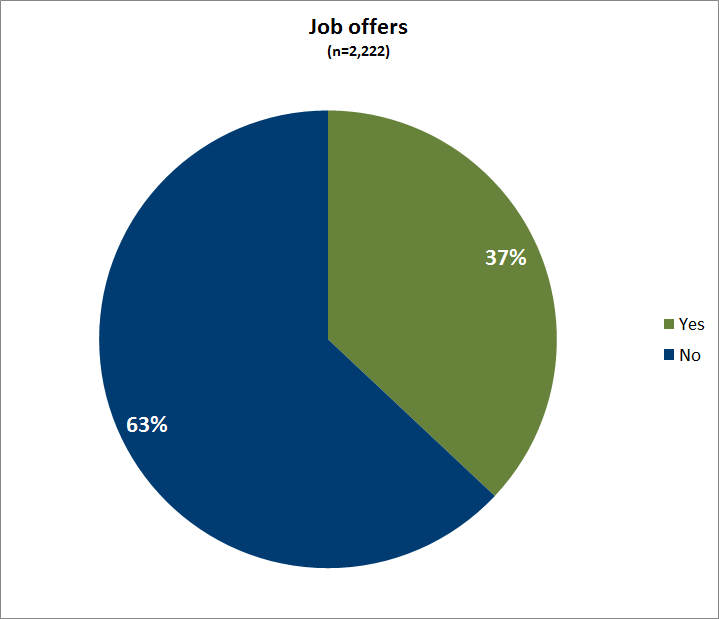
5.6 Job offers
Overall, almost four in 10 (37 per cent) have job offers in the field of engineering.
The results are similar regardless of gender or age. Although those 24 to 26 years of age appear to be slightly more likely to have a job offer, this result is not statistically significant.
| Gender: Male (n=1,723) |
Gender: Female (n=499) |
Age*: 23 or younger (n=1,600) |
Age*: 24 to 26 (n=405) |
Age*: 27 or older (n=217) |
|
|---|---|---|---|---|---|
| Yes | 38% | 35% | 35% | 44% | 36% |
| No | 62% | 65% | 65% | 56% | 64% |
Q17E. Have you already been offered a job(s) in the field of engineering?
Note: Columns may not sum to 100% due to rounding.?
Those who plan to go into the workforce immediately after graduation are the most likely to report that they have already been offered a job in the field of engineering (41 per cent). Many of those travelling have also received such offers (35 per cent), which suggests that they will be working in engineering after they finish travelling. Those least likely to have a job offer are those planning on taking more education, although even among that group 24 per cent report such offers.
| Plans immediately after graduation* | |||
|---|---|---|---|
| Go into the workforce (n=1,350) | Travel/ vacation (n=360) |
More education (n=289) |
|
| Yes | 41% | 35% | 24% |
| No | 59% | 65% | 77% |
Q17E. Have you already been offered a job(s) in the field of engineering?
Note: Due to rounding, totals may not sum to 100%
* Statistical significant difference. Chi sq. p=.000
5.5.1 Job offer, over time
The results in 2016 are very similar to those from last year’s survey.
| 2015 (n=2,010) |
2016 (n=2,222) |
|
| Yes | 38% | 37% |
| No | 62% | 63% |
Q17E. Have you already been offered a job(s) in the field of engineering?
5.5.2 Number of job offers
Among those who report receiving a job offer, the average number of job offers is close to two (1.8). While half of graduating students have received one job offer, the other half have received between two and 12 job offers.
| Number of job offers | (n=821) |
|---|---|
| One | 52% |
| Two | 29% |
| Three | 11% |
| Four | 5% |
| Five or more | 3% |
| Average number of job offers | 1.8 |
Q17F. How many jobs have you been offered in the field of engineering?
Note: Due to rounding, total may not sum to 100%.?
5.6.3 Number of job offers, over time
The number of students offered jobs is similar to last year.
| Number of job offers | 2015 (n=688) |
2016 (n=816) |
|---|---|---|
| One | 58% | 52% |
| Two | 25% | 29% |
| Three | 11% | 11% |
| Four | 3% | 5% |
| Five or more | 2% | 3% |
| Average number of job offers | 1.1 | 1.8 |
Q17F. How many jobs have you been offered in the field of engineering?
Note: Columns may add to more than 100%.?
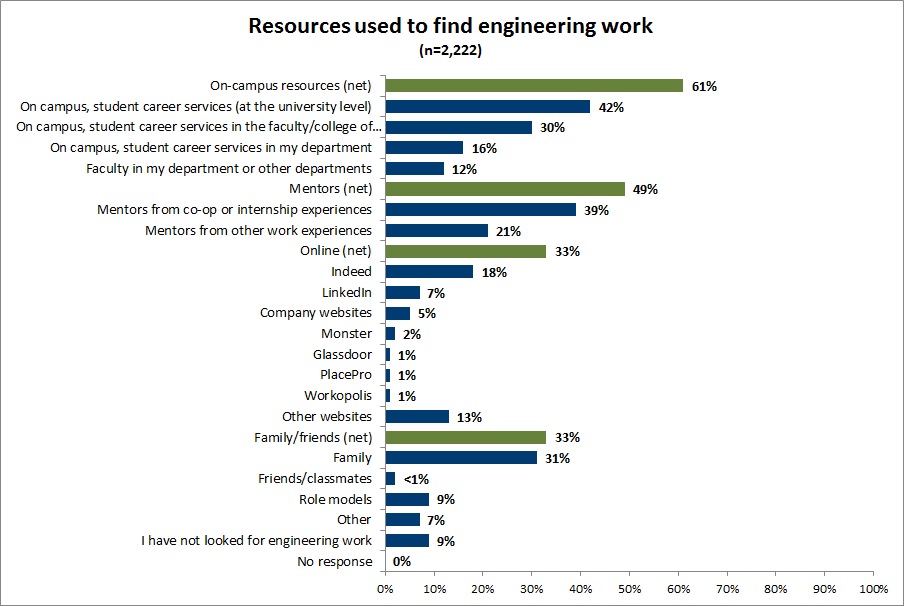
5.7 Resources used
The most common resources used to find engineering work are as follows:
- On-campus resources. About six in 10 report using at least of one on-campus resource. Most commonly—mentioned by four in 10 respondents—they used the student career services at their post-secondary institution.
- Mentors. About half indicated they had used mentors, particularly mentors from co-op or internship experience, which almost four in 10 students report using.
- Online resources. About one in three also used online resources. In particular, the site Indeed was used by almost one in five respondents.
- Family and friends. About one in three report using family or friends as a resource for finding work, particularly family members, which three in 10 respondents report using.
The youngest students are more likely to rely on on-campus resources and mentors from co-ops and internships to find engineering work, than are their older cohorts.
| On campus | Gender: Male (n=1,723) |
Gender: Female (n=499) |
Age*: 23 or younger (n=1,600) |
Age*: 24 to 26 (n=405) |
Age*: 27 or older (n=217) |
|---|---|---|---|---|---|
| On-campus, student career services (at the post-secondary institution level) | 42% | 41% | 43% | 40% | 36% |
| On-campus, student career services in the faculty/college of engineering | 29% | 34% | 32% | 27% | 22% |
| On-campus, student career services in my department | 17% | 12% | 16% | 17% | 12% |
| Faculty in my department or other departments | 12% | 11% | 12% | 10% | 14% |
| Mentors | |||||
| Mentors from co-op or internship experiences | 38% | 42% | 41% | 39% | 28% |
| Mentors from other work experiences | 21% | 20% | 20% | 24% | 23% |
| Online | |||||
| Indeed | 18% | 17% | 19% | 15% | 19% |
| 6% | 8% | 6% | 7% | 9% | |
| Company websites | 5% | 6% | 5% | 5% | 3% |
| Monster | 2% | 1% | 2% | 2% | 2% |
| Glassdoor | 1% | 2% | 1% | 1% | 2% |
| PlacePro | 1% | 1% | 1% | <1% | - |
| Workopolis | 1% | 1% | 1% | 1% | 2% |
| Other websites | 13% | 15% | 14% | 11% | 18% |
| Family/friends | |||||
| Family | 31% | 31% | 34% | 26% | 24% |
| Friends/classmates | 2% | 2% | 1% | 4% | 2% |
| Other | |||||
| Role models | 9% | 11% | 10% | 6% | 7% |
| Other | 8% | 4% | 7% | 6% | 11% |
| I have not looked for engineering work | 9% | 10% | 9% | 10% | 13% |
| No response | <1% | - | <1 | - | - |
Q17G. What resources have you used to find engineering work?
Note: Respondents could choose more than one response. Columns may add to more than 100%.?
Those who have already received a job offer are more likely to have used mentors from a co-op or internship experience (52 per cent) as a resource than those who do not have a job offer (32 per cent). Those who have not received a job offer are more likely to have used on-campus career services (whether at the post-secondary institution, faculty, or department level) or websites, than those with job offers.
| Resources | Offered job Yes (n=821) |
Offered job No (n=1,401) |
|---|---|---|
| Mentors from co-op or internship experiences | 52% | 32% |
| On-campus, student career services (at the post-secondary institution level) | 34% | 47% |
| Family | 24% | 36% |
| On-campus, student career services in the faculty/college of engineering | 23% | 35% |
| Mentors from other work experiences | 23% | 20% |
| On-campus, student career services in my department | 11% | 19% |
| Faculty in my department or other departments | 10% | 13% |
| Indeed | 9% | 23% |
| Role models | 8% | 10% |
| 5% | 8% | |
| Other websites | 8% | 17% |
| I have not looked for engineering work | 2% | 14% |
Q17G. What resources have you used to find engineering work?
Note: Respondents could choose more than one response. Columns may sum to more than 100%.?
5.7.1 Finding work, over time
The results are very similar over time, except for the huge growth in the use of websites, including social media sites. While 14 per cent mention a website as a resource to help them find work in 2015, this jumps to 48 per cent who report the same in 2016.[2]
| Resources | 2015 (n=688) |
2016 (n=821) |
|---|---|---|
| Over time offered job |
||
| Mentors from co-op or internship experiences | 58% | 52% |
| On-campus, student career services (at the post-secondary institution level) | 32% | 34% |
| Family | 31% | 24% |
| On-campus, student career services in the faculty/college of engineering | 24% | 23% |
| Mentors from other work experiences | 24% | 23% |
| On-campus, student career services in my department | 10% | 11% |
| Faculty in my department or other departments | 14% | 10% |
| Websites | 14% | 48% |
| Role models | 11% | 8% |
| Other | 15% | 11% |
| I have not looked for engineering work | - | 2% |
Q17G. What resources have you used to find engineering work?
Note: Respondents could choose more than one response. Columns may add to more than 100%.?
6.0 Professional activity
6.1 Professional engineering licensure
About eight in 10 indicate that they definitely (50 per cent) or probably (29 per cent) will apply to their provincial association for licensure as a professional engineer (P.Eng.). The remaining one in five either won’t (13 per cent) or are unsure if they will (9 per cent).
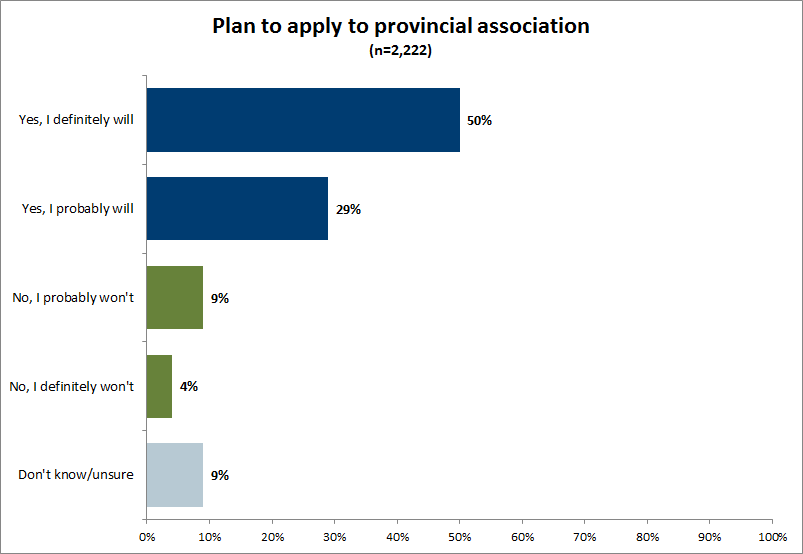
Men and women are just as likely to indicate that they definitely or probably will apply to their provincial association for licensure. The older the student, the more likely they are to indicate that they will definitely apply. While two in three of those 27 years of age or older indicate that they definitely will apply, less than half of those 23 or younger say the same thing.
| Gender: Male (n=1,723) |
Gender: Female (n=499) |
Age*: 23 or younger (n=1,600) |
Age*: 24 to 26 (n=405) |
Age*: 27 or older (n=217) |
|
|---|---|---|---|---|---|
| Yes, I definitely will | 59% | 49% | 47% | 50% | 66% |
| Yes, I probably will | 29% | 30% | 30% | 27% | 24% |
| No, I probably won't | 9% | 9% | 10% | 8% | 3% |
| No, I definitely won't | 4% | 3% | 4% | 5% | 2% |
| Don't know/unsure | 9% | 9% | 9% | 10% | 5% |
Q21. Do you intend to apply to your provincial association for licensure as a Professional Engineer (P.Eng.)?
Note: Due to rounding, columns may not sum to 100%.* Statistical significant difference. Chi sq. p=.000?
Whether or not a respondent has a job offer in the field of engineering does not appear to make any difference in their plans to apply for licensure. Among those who report having a job offer, 52 per cent say they will definitely apply, compared to 48 per cent of those who do not have a job offer.
6.1.1 Licensure, over time
After three years of decline, in 2016 there was a small increase in the percentage of students who report that they will definitely apply for licensure.
| 2013 (n=2,501) |
2014 (n=2,046) |
2015 (n=2,010) |
2016 (n=2,222) |
|
|---|---|---|---|---|
| Yes, I definitely will | 55% | 49% | 46% | 50% |
| Yes, I probably will | 28% | 30% | 30% | 29% |
| No, I probably won't | 8% | 9% | 12% | 9% |
| No, I definitely won't | 3% | 4% | 4% | 4% |
| Don't know/unsure | 7% | 9% | 9% | 9% |
Q21. Do you intend to apply to your provincial association for licensure as a Professional Engineer (P.Eng.)?
Note: Columns may add to more than 100%.?
6.1.2 Reasons for not applying
Those who do not intend on applying for their licence say it is because they are not planning to work as an engineer or are not sure that they will, or they are planning to apply for the licence in another province or are going to be working outside the country.
| Reason | (n=284) |
|---|---|
| Don't need it/field I'm in doesn't benefit me | 32% |
| Apply for licence in other province/work in other province | 28% |
| Unsure/will not work in the field | 13% |
| Work outside of the country | 11% |
| Cost/don't have a P.Eng. I can work under/can't get the required experience/no time/more work | 5% |
| Only if I have to | 2% |
| Other | 16% |
| Don't know /no response | 1% |
Q23. Why do you not intend to apply for licensure as a Professional Engineer (P.Eng.)?
Note: Respondents could choose more than one response. Columns may sum to more than 100%.?
6.1.3 Apply when it is legally required
Those who are not planning to apply, or are not sure if they will, were informed that in order to refer to themselves as an engineer or to practice as an engineer, a licence is legally required. Upon knowing this, when asked again if they plan to apply for their P.Eng. licence, about one in three said that they will definitely (16 per cent) or probably will (18 per cent) do it.
Given that licensure is required, those who plan to go immediately into the workforce (22 per cent) are slightly more likely to definitely apply than those who plan to pursue education (16 per cent) or travel (7 per cent). However, there was no difference between those who have already received a job offer in the field of engineering (17 per cent would definitely apply) and those who have not (15 per cent would definitely apply).
6.1.4 Legally required, over time
Over the last two surveys, the impact of this knowledge has been similar, as it encourages about one in three respondents to indicate that they definitely or probably will apply. In 2015, many more than in the current survey said they still probably will not apply, while in 2016 far more simply do not know.
| Over time Do not intend to apply 2015 (n=312 |
Over time Do not intend to apply 2016 (n=477 |
|
|---|---|---|
| Yes, I definitely will | 16% | 16% |
| Yes, I probably will | 16% | 18% |
| No, I probably won't | 51% | 27% |
| No, I definitely won't | 13% | 11% |
| Don't know/unsure | 5% | 28% |
Q24. As a licence is required to legally refer to yourself as an engineer, or to practice as an engineer, do you plan to apply for your P.Eng. licence?
Note: Due to rounding, totals may not sum to 100%.?
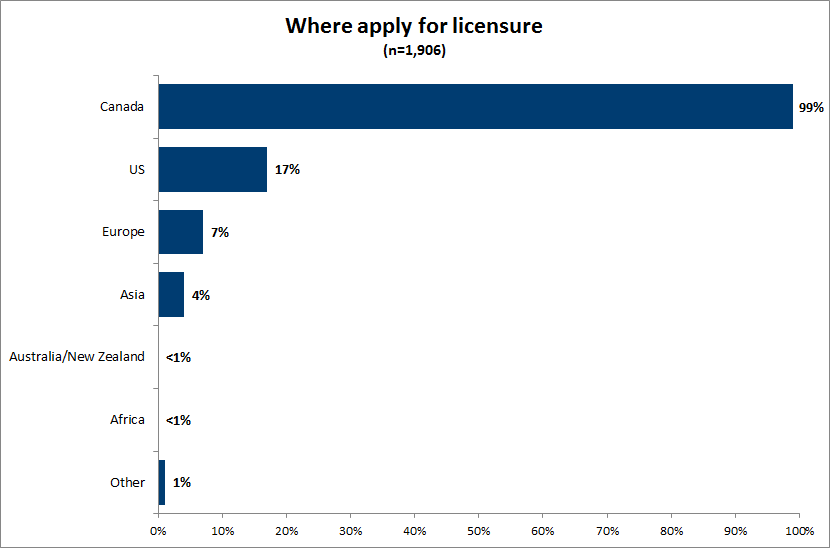
6.2 Where to apply for licensure
Of those who are likely to apply for licensure, almost all (99 per cent) say they will do so in Canada. However, many report that they may also apply in other jurisdictions, especially the United States (17 per cent).
6.3 Timing of application
Over three in four students (77 per cent) report that they will likely apply for membership with their regulatory body within 12 months of graduating, including 62 per cent who intend to do so within six months. Most others simply do not know (15 per cent) when they will apply.
Older respondents are more likely to indicate that they will apply for membership with their regulatory body within six months of graduation. Indeed, three in four of those 27 years of age or older report that they plan to apply within six months of graduation, compared with only six in 10 of those 23 years of age or younger who plan to do so.
| Gender: Male (n=1,473) |
Gender: Female (n=433) |
Age*: 23 or younger (n=1,357) |
Age*: 24 to 26 (n=348) |
Age*: 27 or older (n=201) |
|
|---|---|---|---|---|---|
| Within six months after graduation | 63% | 60% | 59% | 66% | 75% |
| Within a year after graduation | 15% | 16% | 15% | 15% | 14% |
| More than a year after graduation | 8% | 8% | 9% | 6% | 5% |
| Don't know/unsure | 15% | 16% | 17% | 14% | 6% |
Q27. Do you intend to apply for membership with your regulatory body…?
Note: Due to rounding, columns may not sum to 100%...
* Statistical significant difference. Chi sq. p=.000
6.3.1 Timing of application, over time
Over time, a growing number of graduating students indicate that they will apply for membership with their regulatory body within six months of graduation. In 2013, just over four in 10 had such plans, while in 2016 over six in 10 report the same.
| 2013 (n=2,288) |
2014 (n=1,815) |
2015 (n=1,797) |
2016 (n=1,906) |
|
|---|---|---|---|---|
| Within six months after graduation | 44% | 43% | 57% | 62% |
| Within a year after graduation | 17% | 18% | 17% | 15% |
| More than a year after graduation | 20% | 21% | 6% | 8% |
| Don't know/unsure | 19% | 19% | 24% | 15% |
Q27. Do you intend to apply for membership with your regulatory body…?
Note: Due to rounding, columns may not sum to 100%.
6.4 Benefits of applying in first six months
It was explained to those students who were not planning to apply for membership in the first six months that, if they did, they were eligible to have the licence application fee and the first year EIT/MIT program fees waved. Knowing this, almost nine in 10 report they will be very (53 per cent) or somewhat (35 per cent) likely to apply for their licensure in the first six months after graduating.
6.4.1 Benefits, over time
Ever since the survey has been conducted, about nine in 10 are likely to apply within six months, once they know the benefits. The one exception is in 2015, when only about eight in 10 were likely to apply, knowing the benefits.
| 2013 (n=1,290) |
2014 (n=1,044) |
2015 (n=840) |
2016 (n=725) |
|
|---|---|---|---|---|
| Very likely | 58% | 58% | 49% | 53% |
| Somewhat likely | 32% | 31% | 34% | 35% |
| Somewhat unlikely | 4% | 5% | 5% | 3% |
| Very unlikely | 2% | 2% | 2% | 2% |
| Don't know/unsure | 4% | 4% | 10% | 7% |
Q29. If you knew that by applying for licensure within 6 months of graduation you are eligible to have the licence application fee and first year EIT/MIT program fees waived, how likely would you be to apply for licensure within that time frame?
Note: Due to rounding, columns may not sum to 100%?
6.5 Student Membership Program
About six in 10 students report that they have heard of Student Membership Programs (SMP), including about three in 10 who are current members, one in five who are interested in becoming a member, and one in 10 who are aware of the SMP, but are not interested in becoming a member.
Conversely, about four in 10 report that they have never heard of SMPs. While about one in four are interested in becoming a member, another one in seven are not. Put another way, three in four respondents are either a member or interested in becoming one, while one in four are not.
Female students are more likely than their male counterparts to indicate that they are currently members. Conversely, male students are more likely than female students to indicate that they had never heard of the SMP and are not interested in becoming a member.
| Gender: Male (n=1,723) |
Gender: Female (n=499) |
Age*: 23 or younger (n=1,600) |
Age*: 24 to 26 (n=405) |
Age*: 27 or older (n=217) |
|
| I am currently a member (of the SMP) | 29% | 32% | 29% | 25% | 39% |
| I've heard of them/it and am interested in becoming a member | 20% | 21% | 19% | 23% | 23% |
| I've heard of them/it but am not interested in becoming a member | 10% | 10% | 10% | 11% | 8% |
| I have never heard of them/it and am interested in becoming a member | 25% | 29% | 26% | 27% | 19% |
| I have never heard of them/it and am not interested in becoming a member | 17% | 9% | 16% | 15% | 11% |
Q32. Which of the following best describes your knowledge of the Student Membership Programs (SMP) offered through some of the provincial and territorial engineering regulatory associations?
Note: Due to rounding, columns may not sum to 100%* Statistical significant difference. Chi sq. p=.000?
6.6 Plans to stay in Canada
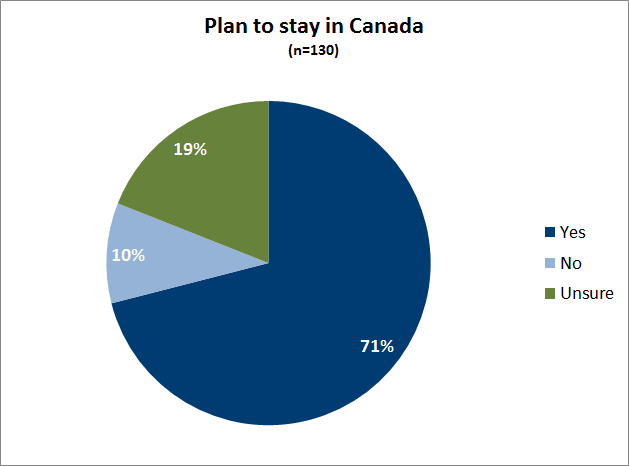
Those who are not permanent residents of Canada (about 6 per cent of students) were asked if they plan on staying in Canada after their bachelor’s degree is complete. About seven in 10 have such plans and another one in five is not sure. Only one in 10 has no plans to stay in Canada.
6.6.1 Plans to stay in Canada, over time
Compared to 2015, a few more students are planning on staying in Canada in 2016.
| 2015 (n=170) |
2016 (n=130) |
|
|---|---|---|
| Yes | 62% | 71% |
| No | 16% | 10% |
| Unsure | 21% | 19% |
Q36A. Do you plan on staying in Canada after your bachelor’s degree is complete?
Note: Due to rounding, columns may not sum to 100%.?
6.6.2 Reasons for not staying
The 13 respondents who were not planning on staying were asked why. The most common reasons for not intending on staying in Canada are the following:
- There are better job opportunities and/or higher pay elsewhere (n=6).
- They are planning to live elsewhere or go home to their country (n=4).
- Once they graduate with their bachelor’s degree, they are planning to go to school outside of Canada (n=2).
| Reasons | n | % |
|---|---|---|
| Better job opportunities/pay elsewhere | 6 | 46% |
| Living elsewhere/going back to my home country | 4 | 31% |
| Going to school outside of Canada | 2 | 15% |
| Moving to US/better options/work in US | 1 | 8% |
| Cold weather | 1 | 8% |
| Want to travel/explore | 1 | 8% |
| Other | 1 | 8% |
Q36B. Why do you not intend on staying in Canada?
Note: Multiple reasons accepted, therefore totals may not sum to 100%. Caution small sample.?
7.0 Understanding of licencing roles and requirements
7.1 Licencing requirement
Most students correctly identified that a professional engineers’ licence is required for the following:
- To practice engineering work independently. While over eight in 10 indicate that this is the case, almost one in five either say no (10 per cent) or say they do not know (6 per cent).
- To use the title “engineer.” While over three in four indicate that this is the case, almost one in four say it is not needed (18 per cent) or do not know (5 per cent).
Most students correctly state that a professional engineers’ licence is not required for the following:
- To practice engineering work under the supervision of a P.Eng. While one in five say a licence was required, three in four indicate it is not needed (77 per cent) or do not know (4 per cent).
7.1.1 Requirements score
As shown in the figure below, about half of the respondents receive a high score, answering all three statements correctly (that is, a licence is required to practice engineering work independently and to use the title “engineer,” but not to practice engineering work under the supervision of a P.Eng.).
Regardless of age or gender, there are no statistical differences in the number of correctly identified answers.
| Requirements score | Gender: Male (n=1,723) |
Gender: Female (n=499) |
Age*: 23 or younger (n=1,600) |
Age*: 24 to 26 (n=405) |
Age*: 27 or older (n=217) |
|---|---|---|---|---|---|
| High (3 correct) | 50% | 56% | 52% | 51% | 52% |
| Moderate (2 correct) | 40% | 32% | 38% | 37% | 38% |
| Low (1 correct) | 8% | 8% | 8% | 8% | 8% |
| None (0 correct) | 2% | 4% | 2% | 4% | 2% |
Q8. As far as you know, is a professional engineers' licence required before being able to…
Note: Due to rounding, columns may not sum to 100%.?
7.1.2 Licencing requirements, over time
Over time, awareness that a professional engineers’ licence is required to practice engineering work independently has remained constant, with over eight in 10 saying this is the case. Awareness that it is required to use the title “engineer” had been falling, but rebounded in the most recent survey.
Similarly, the belief that a licence is needed to practice engineering work under the supervision of a P.Eng. had been falling, but rebounded in 2016, with one in five incorrectly stating that a licence is required.
| Yes, required to… | 2013 (n=2,501) |
2014 (n=2,046) |
2015 (n=2,010) |
2016 (n=2,222) |
|---|---|---|---|---|
| Practice engineering work independently | 85% | 85% | 85% | 84% |
| Use the title “engineer” | 75% | 74% | 72% | 77% |
| Practice engineering work under the supervision of a P.Eng | 20% | 17% | 13% | 19% |
Q8. As far as you know, is a Professional Engineers' licence required before being able to…
7.1.3 Score, over time
The number of statements correctly identified as requiring a licence has remained fairly consistent over time. About half of the respondents get a high score answering all three correctly, while about four in 10 get a moderate score, correctly answering two.
| Requirements score | 2013 (n=2,501) |
2014 (n=2,046) |
2015 (n=2,010) |
2016 (n=2,222) |
|---|---|---|---|---|
| High (3 correct) | 47% | 50% | 53% | 52% |
| Moderate (2 correct) | 42% | 40% | 36% | 38% |
| Low (1 correct) | 8% | 7% | 8% | 8% |
| None (0 correct) | 3% | 3% | 3% | 3% |
Q8. As far as you know, is a Professional Engineers' licence required before being able to…
Note: Due to rounding, columns may not sum to 100%.?
7.2 Licencing roles
Most respondents indicate that the provincial association is responsible for the following:
- Licensing professional engineers. Nine in 10 correctly indicate that this is the responsibility of the provincial association, while one in 10 say it is Engineers Canada.
- Regulating the practice of professional engineering. Eight in 10 correctly indicate that regulating the practice is the responsibility of the provincial association, while one in four say it is Engineers Canada.
- Promoting the interests of professional engineers. Almost eight in 10 indicate this is the responsibility of the provincial association, while four in 10 say it is the responsibility of Engineers Canada. Many see this as dual responsibility, which is, in fact, the case.
- Licensing companies offering engineering services to the public. Six in 10 correctly indicate such licencing is the responsibility of the provincial association, while three in 10 incorrectly say it is Engineers Canada. While some see this as a dual responsibility, about one in five simply do not know.
Most respondents indicate that Engineers Canada is responsible for the following:
- Accrediting post-secondary institution engineering programs. Almost nine in 10 correctly say this is the responsibility of Engineers Canada (CEAB), while one in 10 say it is the responsibility of the provincial associations.
There does not appear to be any difference in responses by age or gender.
As shown in the figure below, almost half have high knowledge scores, correctly identifying the organization that is responsible in all five cases.[3] A similar number have moderate knowledge, correctly identifying the organization responsible for three or four of these activities.
7.2.1 Results over time
Over time, respondents appear to be more knowledgeable about the responsibilities of the provincial associations and Engineers Canada.
| Provincial association | 2013 (n=2,501) |
2014 (n=2,046) |
2015 (n=2,010) |
2016 (n=2,222) |
|---|---|---|---|---|
| Licences professional engineers | 90% | 90% | 90% | 91% |
| Regulates the practice of professional engineering | 83% | 80% | 80% | 83% |
| Promotes the interests of professional engineers | 70% | 69% | 75% | 77% |
| Licences companies offering engineering services | 50% | 53% | 55% | 60% |
| Accredits post-secondary institution engineering programs | 25% | 20% | 11% | 12% |
| Engineers Canada | ||||
| Licences professional engineers | 11% | 9% | 9% | 11% |
| Regulates the practice of professional engineering | 27% | 26% | 25% | 26% |
| Promotes the interests of professional engineers | 44% | 48% | 40% | 41% |
| Licences companies offering engineering services | 32% | 30% | 32% | 30% |
| Accredits post-secondary institution engineering programs | 70% | 74% | 87% | 88% |
Q9. Please indicate the organization(s) responsible for the following activity/procedure:
Student knowledge of the organizations responsible for professional engineering appears to be increasing over time. In each of the past four years, the percentage of students who have correctly identified the responsible organization for all five of these activities has increased from 33 per cent to 46 per cent.
| Knowledge | 2013 (n=2,501) |
2014 (n=2,046) |
2015 (n=2,010) |
2016 (n=2,222) |
|---|---|---|---|---|
| High (5 correct) | 33% | 37% | 44% | 46% |
| Moderate (3 or 4 correct) | 56% | 54% | 48% | 46% |
| Low (1 or 2 correct) | 6% | 5% | 4% | 5% |
| None (0 correct) | 4% | 4% | 4% | 3% |
Q9. Please indicate the organization(s) responsible for the following activity/procedure:
Note: Due to rounding, columns may not sum to 100%.?
8.0 Conclusions and highlights
For about two in three of the surveyed graduating students, engineering appears to be something many have had a strong inclination towards since early in their lives; engineering is something they have planned to do since they were in high school, or even prior to that. Exposure to a role model or someone who was in the profession when they were growing up influenced their choice of profession. About half of these students personally knew someone who was an engineer when they were growing up. Among those who knew an engineer, they were more likely to be younger when they made the decision to go into engineering.
Immediately after graduating, only about six in 10 students say they plan to go immediately into the workforce. The others will delay their work life for months to travel or to go on vacation (16 per cent), or for years to pursue more education (13 per cent).
Eventually, nine in 10 of these students plan to pursue a career in the field of engineering. However, only 60 per cent say this is definitely their plan. Another 30 per cent say they probably will, while the remaining either won’t (5 per cent) or are not sure (5 per cent).
Even before graduating, about four in 10 students report having had job offers in the field of engineering. While the proportion of students who received offers remained the same, the average number of offers received is up from last year. Those who received a job offer were more likely than those who did not to use mentors from co-op or internship experiences to find work. Those who had no job offers were more likely to have used on-campus, student career services and websites.
The number of students who correctly identify the responsibilities of their provincial association and Engineers Canada has grown steadily from 33 per cent in 2013 to 46 per cent in 2016. However, the understanding of when a licence is required has not changed much in the same period. Only about half of these graduating students correctly know three basic facts of licensure: a licence is required to practice engineering work independently and to use the title “engineer,” but it is not needed to practice engineering work under the supervision of a P.Eng.
Endnotes
[1] Comparison over time is not possible as the question changed from a single to a multiple response. The questions read: Q17 What type of career do you plan to pursue?
[2] About half of the students using the internet as a resource appears to be more realistic than 14%. It seems unlikely that this is a change in behavior. It is more likely that this results from some difference in the survey in the two years.
[3] To count as correct, a respondent could identify either the provincial association or Engineers Canada as responsible for promoting the interests of professional engineers; they did not have to identify both.