The graduating class of 2017
Engineers Canada surveyed 2,485 engineering students who were completing their final year of studies in 2017. Engineers Canada was interested to find out more about students’ reasons for entering an engineering program, their experiences while studying engineering, and their future plans.
Two questions were adopted from another source. The questions “Q4F. Rate yourself on each of the following traits as compared to your classmates. We want the most accrue estimate of how you see yourself.” and “Q4G. How important do you think each of the following skills and abilities is to becoming a successful engineer?” were adopted from the “Academic Pathways of People Learning Engineering Survey project” (National Science Foundation Grant No. ESI-0227558).
Overall, 2,485 students completed the survey[1]. Of the 2,485 students who responded, 28 per cent were female. Approximately seven out of 10 students were between 20 and 23 years old and nearly 18 per cent were between 24 and 27. The remaining students were over 27 years old.
| Province | Completed surveys | % |
|---|---|---|
| British Columbia | 310 | 13% |
| Alberta | 270 | 11% |
| Saskatchewan | 84 | 3% |
| Manitoba | 64 | 3% |
| Ontario | 1,003 | 40% |
| Quebec | 550 | 22% |
| New Brunswick | 95 | 4% |
| Nova Scotia | 60 | 2% |
| Newfoundland | 47 | 2% |
| Prince Edward Island | 2 | <1% |
| Total | 2,485 | 100% |
Note: Due to rounding, columns may not sum to 100 per cent.
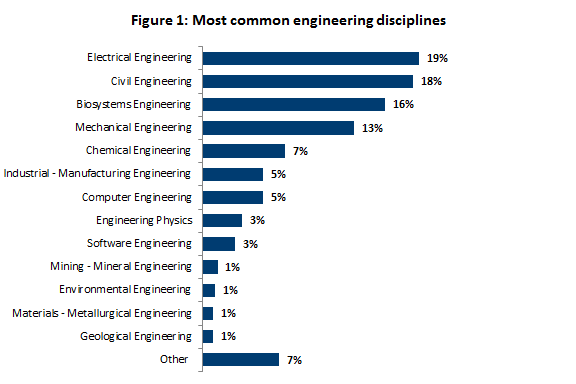
The most common engineering disciplines studied by these graduates were electrical engineering (19 per cent), civil engineering (18 per cent), biosystems engineering (16 per cent), and mechanical engineering (13 per cent).
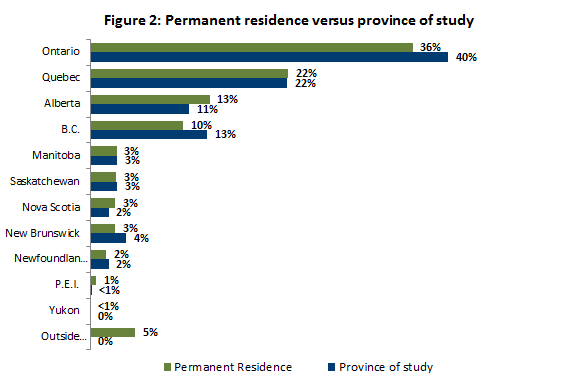
About four in 10 students who responded to the survey were studying in Ontario, while two in 10 were studying in Quebec. This distribution is reflective of the findings in Engineers Canada’s Enrolment and Degrees Awarded Report.[2] Approximately five per cent of graduating students are international students.
About the students
A typical student who responded to the Engineers Canada Final Year Student Exit Survey is a 23-year-old male, with a grade point average between a B- and a B+. More often than not, the student has participated in an internship or co-op as part of their engineering program.
Meet Danny, Ashley, and Alexandre…

Engineering students from across Canada who exemplify the post-secondary engineering experience for this year’s survey respondents.
Q36C. In what year were you born?
Q36D. Are you…?
Q36E. As you know, we all live in Canada, but we come from many different ethnic backgrounds. What are your main ethnic or cultural backgrounds?
Q3A. Approximately, what is your cumulative grade point average (GPA)?
Q4D3. Did you participate in an industry-based internship or co-op during your degree program?
| 2017 | |
|---|---|
| Age | |
| 23 or under | 72% |
| 24 to 26 | 18% |
| 27 or older | 11% |
| Average age | 23 years old |
| Gender | |
| Male | 72% |
| Female | 28% |
| Other | <1% |
| Ethnic or cultural background | |
| British | 28% |
| Western European | 28% |
| Southern or Eastern European | 16% |
| East Asian | 14% |
| South Asian | 8% |
| West Asian or Middle Eastern | 5% |
| Southeast Asian | 4% |
| African or African American | 4% |
| Central/South American | 2% |
| Indigenous person | 2% |
| Caribbean | 2% |
| French Canadian | 2% |
| Other | 7% |
| GPA | |
| A- or higher | 36% |
| B- to B+ | 56% |
| C or C+ | 6% |
| C- or lower | <1% |
| Participated in internship or co-op during program | |
| Yes | 75% |
| No | 25% |
Note: Age calculated as of December 31, 2016.
Note: Statistically significant differences
Large sample sizes may inflate measures of statistical significance and may lead to false conclusions about the strength of association. The chi-square measure of association, in particular, is susceptible to this possibility. Therefore for the purposes of this report, the standards for designating whether a relationship can be termed statistically significant have been increased: the Pearson’s chi-square must have probability of a type 1 error of less than .001 and either the Phi coefficient or Cramer’s V must have a value of .150 or greater. Throughout this document, any differences reported meet these criteria, unless otherwise stated.
Comparisons were made between regions, over time, between genders and age groups (20-23; 24-27 and 27+). If the differences are not noted, it can be assumed that there were no statistically significant findings.
Caution should be used in comparing results over time, as the institutions participating in the survey each year may have changed. In addition, question wording and response categories may have been modified over time. Therefore, it is difficult to know if any change in response is due to actual changes in the attitudes and behaviours of students, or if it is because of who participated and the wording of the question. Throughout the report, we have attempted to identify cases where wording or response categories have changed from one year to the next.
Why students chose to study engineering
Many students decided to pursue engineering as teenagers; about two in three students reported that they made their choice before finishing high school.

Danny - 23 years old
Danny is a typical engineering graduate. He completed his undergraduate education at a university in Ontario with a degree in electrical engineering. He made the decision to study engineering before he finished high school because he liked math and science and thought that engineering would be a great way to use those in practical applications. Danny has a B average and participated in a co-op as a part of his studies.
However, graduates from Quebec (29 per cent) were much less likely than those in other regions (57 per cent to 77 per cent in other regions) to have made their decision while in high school. Students in Quebec were likely to decide early in their post-secondary careers, many of whom decided during or immediately after CEGEP (44 per cent). Two in 10 students nationally decided while in the first few years of their post-secondary studies.
Q4b. When did you make your decision to pursue engineering?
| 2015 | 2016 | 2017 | |
|---|---|---|---|
| When I was a small child | 9% | 8% | 8% |
| While I was in high school | 70% | 58% | 59% |
| After high school, but before starting post-secondary studies/CEGEP | - | 11% | 9% |
| During first year of post-secondary studies/CEGEP | 7% | 7% | 7% |
| During second year of post-secondary studies/CEGEP | 2% | 8% | 6% |
| After second year of post-secondary studies/CEGEP | 2% | 6% | 6% |
| After taking/finishing another post-secondary program | - | 2% | 2% |
| While working | 5% | - | 1% |
| Other | 6% | 2% | 1% |
Those 23 or under (72 per cent) were more likely to say they made their decision while in high school compared to those 24- to 26-years-old (34 per cent) or 27 and older (17 per cent). Those 24 and older tend to be more likely to have made their decision while in post-secondary studies or after completing another post-secondary program.
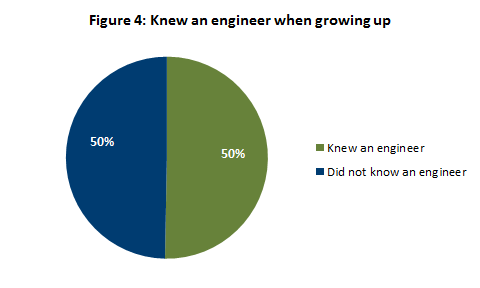
When asked to identify the main reasons they decided to pursue engineering, graduates most commonly said it was related to their interests (65 per cent), they liked the application of science and math (63 per cent), and they liked the practical nature of engineering (58 per cent). These have been the most common reasons to pursue engineering cited over the past three years. Only 15 per cent said they had a role model that influenced their decision to pursue engineering, although 50 per cent of respondents indicated they knew an engineer growing up.
Q4A. Thinking back to when you decided to pursue engineering, what were the main reasons you choose to study this discipline? Please select all that apply.
| 2015 | 2016 | 2017 | |
|---|---|---|---|
| Related to some of my interests | 65% | 65% | 65% |
| Application of science and math | 63% | 62% | 63% |
| The practical, applied nature of engineering | 56% | 60% | 58% |
| Job security | 41% | 43% | 44% |
| The challenge | 41% | 44% | 43% |
| Financial security | 42% | 44% | 42% |
| To positively influence the world/my community | 34% | 36% | 37% |
| Took related courses and liked them | 25% | 26% | 29% |
| Family influence | 29% | 26% | 26% |
| Because of a role model | 15% | 14% | 15% |
| Helps me reach another goal (e.g., becoming a doctor) | 9% | 9% | 10% |
| Other | 4% | 3% | 2% |
As graduates get older, they are less likely to say that they pursued engineering because they liked the application of science and math, decreasing from 68 per cent of those 23 or under, to 46 per cent of those 27 and older.
The post-secondary engineering experience

Ashley – 22 years old
During her time in chemical engineering at an Atlantic University, Ashley usually found herself in the minority in her classes, with only about one quarter of her fellow engineering students being women. Like many of her classmates, she participated in extra-curricular activities while at university, as a member of student government. Though she found it difficult to find a school-life balance with her course workload, support from her friends and family helped immensely. She held an internship position during the last years of her studies, which she says influenced her to pursue a career in engineering now that she has graduated.
Barriers to completing degree
Almost three in four graduates indicated that the greatest barrier to completing their degree was other demands on their time, including maintaining a suitable school-life balance (30 per cent) and managing the workload of their courses (30 per cent).
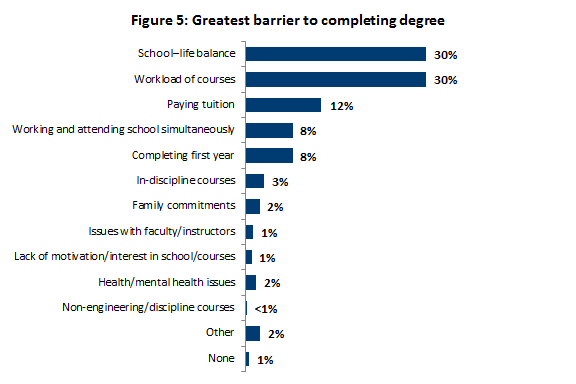
As graduates get older, they are more likely to indicate that working and attending school simultaneously (increasing from five per cent to 17 per cent) and family commitments (increasing from one per cent to 13 per cent) were barriers. Conversely, as graduates get older, they are less likely to mention school-life balance (decreasing from 31 per cent to 19 per cent) and workload of courses (33 per cent to 18 per cent).
Again, likely related to the age of graduates by region, those in Quebec are more likely to mention working and attending school simultaneously (16 per cent versus 5–6 per cent) and less likely to mention the workload of courses (21 per cent versus 28–33 per cent) than graduates in other regions.
Barriers, over time
Over the past three years, school-life balance and the workload of courses have been the most common barriers graduates have faced when completing their degree.
Q4E. Considering all of your experiences in studying for your engineering discipline, what has been the single greatest barrier to completing your degree?
| 2015 | 2016 | 2017 | |
|---|---|---|---|
| School-life balance | 30% | 31% | 30% |
| Workload of courses | 32% | 26% | 30% |
| Paying tuition | 12% | 12% | 12% |
| Working and attending school simultaneously | 7% | 9% | 8% |
| Completing first year | 6% | 7% | 8% |
| In-discipline courses | 4% | 3% | 3% |
| Family commitments | 2% | 3% | 2% |
| Health/mental health issues | - | - | 2% |
| Lack of motivation/interest in school/courses | - | - | 1% |
| Issues with faculty/instructors | - | - | 1% |
| Non-engineering/discipline courses | - | - | <1% |
| Other | 8% | 4% | 2% |
| None | - | <1% | 1% |
Perceptions of post-secondary experiences
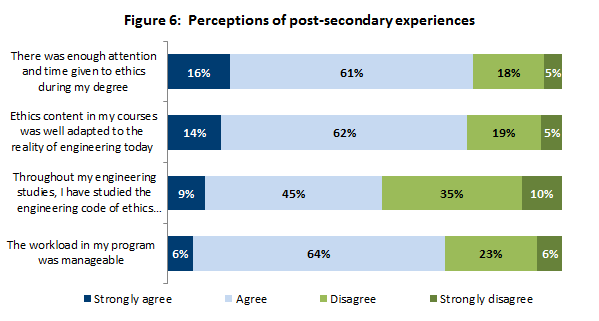
When asked for their level of agreement with four statements about their post-secondary experiences, graduates were most likely to agree that there was enough attention and time given to ethics during their degree (77 per cent) and ethics content in their courses were well adapted to the reality of engineering today (76 per cent). However, in both cases, only about one in six graduates strongly agreed.
Although 54 per cent agreed that throughout their engineering studies, they have studied the engineering code of ethics in depth and 70 per cent agreed that their workload is manageable, fewer than 10 per cent strongly agreed with each statement.
Perceived gaps and strengths of program
Respondents were asked to rate 11 skills and abilities on two different scales: their perceived skill set relative to their classmates, and the importance of each skill set in becoming a successful engineer.
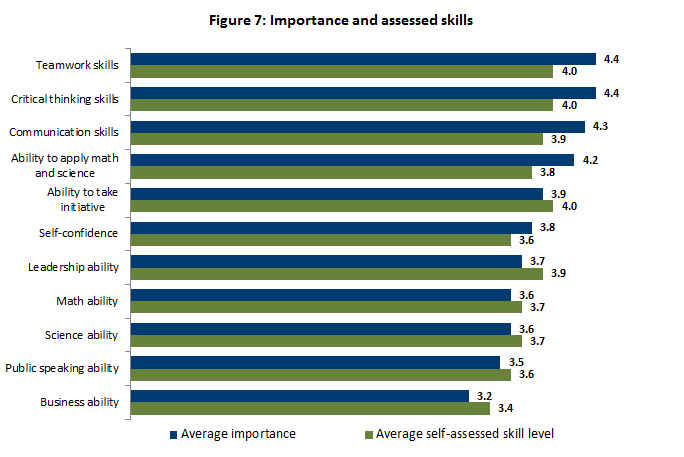
Male graduates tend to rate themselves higher when compared to their classmates on most of the 11 items tested, with two showing levels of statistical difference. In both cases, male graduates were more likely than female graduates to rate themselves in the highest 10 per cent, which included self-confidence (22 per cent versus nine per cent) and the ability to apply math and science principles to solving real-world problems (23 per cent versus nine per cent). However, there were no statistical differences by gender and the importance of each of the 11 skills and abilities tested.
Although there were no differences in self-assessed skill levels among graduates by region, graduates from Quebec (38 per cent) were less likely than those in other regions (48 per cent to 55 per cent) to rate communication skills as crucially or absolutely essential.
Extracurricular activities
Overall, about nine in 10 graduates said they participated in at least one extracurricular activity while in their program, most commonly working off (48 per cent) or on (28 per cent) campus.
Q4D. Did you participate in any of the following extracurricular activities during your degree program?
| 2017 | |
|---|---|
| Work | 61% |
| Worked off campus | 48% |
| Worked on campus | 28% |
| Organizations/clubs | 55% |
| Design competitions/teams/clubs | 35% |
| Discipline-specific engineering organization | 22% |
| Student government (not including CFES) | 19% |
| Arts | 11% |
| Social impact clubs | 9% |
| Social identity clubs | 6% |
| Canadian Federation of Engineering Students (CFES) | 1% |
| Other | |
| Volunteer work/community service | 36% |
| Athletic clubs and teams | 35% |
| Professional development | 18% |
| Family involvement | 15% |
| General recreational sports and activities, non-varsity | 1% |
| Sorority/fraternity | <1% |
| Other | 3% |
| No extracurricular activities | |
| None | 11% |
Female graduates appear to be more involved than their male counterparts in most extracurricular activities, with the biggest differences for volunteer work (49 per cent female versus 30 per cent male), student government (30 per cent versus 15 per cent), arts (20 per cent versus eight per cent), and social impact clubs (18 per cent versus six per cent).
As graduates get older, they are less likely to have participated in many extracurricular activities, most notably athletic clubs and teams (40 per cent of those 23 and under to 14 per cent of those 27 and older) and design competitions (37 per cent of those 23 and under to 25 per cent of those 27 and older).
Graduates from Quebec were less likely to have participated in volunteer activities (24 per cent versus 35 to 46 per cent) and athletics (21 per cent versus 30 to 44 per cent) than graduates in other regions, and most likely to say they did not participate in any extracurricular activities (16 per cent versus eight to 10 per cent).
Hours spent on extracurricular activities
For those involved in extracurricular activities, the majority (69 per cent) spent 10 or fewer hours per week on these activities during their program, with nine per cent spending more than 20 hours per week on extracurricular activities.
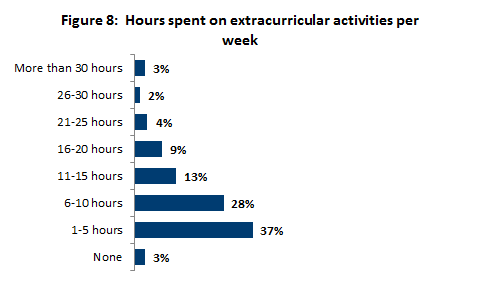
BASE: Those who participated in any extracurricular activities per week (n = 2,209).
Although older participants tend to participate in fewer extracurricular activities, those who did devoted more time than younger participants to these activities. Specifically, 20 per cent of those 27 and older devoted more than 20 hours per week to extracurricular activities compared to seven per cent of those 23 and younger.
Likely because graduating students in Quebec tend to be older, they also reported spending more hours on extracurricular activities. Among those from a Quebec institution, 18 per cent reported spending more than 20 hours per week on extracurricular activities, compared to six to eight per cent in the other three regions.
Supports while at post-secondary institution
Family and friends are the single most important support for students during their engineering studies, as cited by 87 per cent of graduates. People from a co-op or internship (37 per cent) and faculty (33 per cent) also provided support to a considerable number of students during their program.
Q4C. Thinking of all the supports you had during your engineering studies, which of the following have been the most important to you?
| 2015 | 2016 | 2017 | |
|---|---|---|---|
| Family and friends | 86% | 85% | 87% |
| Individuals from a co-op or internship | 34% | 38% | 37% |
| Faculty | 36% | 36% | 33% |
| Off-campus work | 14% | 19% | 17% |
| Engineering societies/clubs | 13% | 13% | 16% |
| Athletics | 11% | 15% | 15% |
| On-campus work | 8% | 10% | 10% |
| Post-secondary institution clubs | 9% | 10% | 9% |
| Other students/classmates | - | - | 1% |
| Religious organizations/members | - | - | <1% |
| None/myself | - | - | <1% |
| Other | 5% | 3% | 2% |
| Don't know | - | - | <1% |
As graduates get older, they are more likely to select off-campus work as being important, increasing from 15 per cent of those 23 or younger, to 27 per cent of those 27 and older, and less likely to select family and friends (decreasing from 89 per cent to 79 per cent) and athletics (decreasing from 17 per cent to eight per cent).
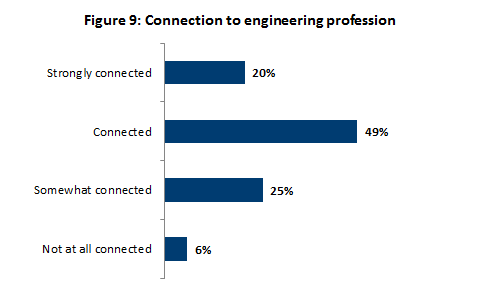
Connection to engineering profession
About seven in 10 graduates feel connected to the engineering profession, with 20 per cent feeling strongly connected.
Perception of self as an engineer or leader
Graduates were asked to rate if they consider themselves to be an engineer. Nearly half (47 per cent) of graduates saying they absolutely consider themselves to be an engineer. Additionally, graduating students were asked if they consider themselves a leader. Yet again, nearly half (45 per cent) absolutely considering themselves a leader.
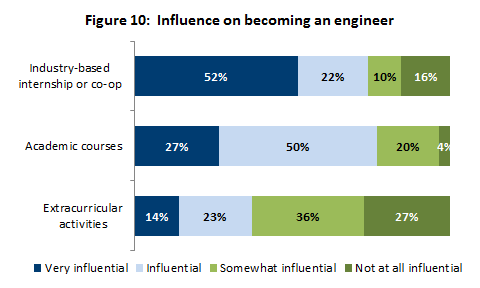
Influences of activities to becoming an engineer
Among three potential influencers on them becoming an engineer, industry-based internships or co-ops had the most influence, with 52 per cent of graduates saying they were very influential on becoming an engineer. Academic courses ranked second, with 27 per cent saying these were very influential. Just 14 per cent ranked extracurricular activities as being very influential.
Students’ future plans

Alexandre – 27 years old
Alexandre graduated with a civil engineering degree from a university in Saskatchewan. He held a co-op position while completing his studies and found that working while attending school simultaneously was a challenge, as was meeting his family commitments. But with his degree and his work experience, he already feels like an engineer—he thinks he’s well-prepared to enter the engineering workforce, and he’s already received a job offer in the same province where he attended school. Recognizing the value of licensure, Alexandre definitely plans to pursue his professional engineering licence.
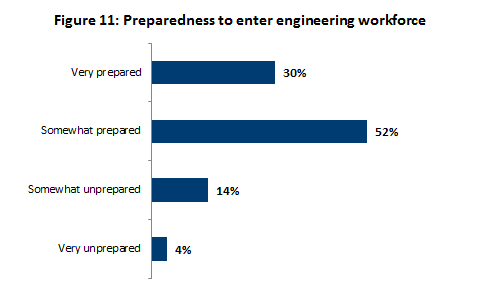
Preparedness to enter engineering
About eight in 10 graduates feel prepared to enter the engineering workforce, with 30 per cent saying they feel very prepared.
As graduates get older, they are more likely to say they feel very prepared to enter the engineering workforce, increasing from 26 per cent of those 23 or younger to 45 per cent of those 27 and older.
Reason for feeling prepared
Among those who feel very or somewhat prepared to enter the engineering workforce, graduates primarily said it is because of their co-op, work term, or internship (31 per cent). Otherwise, graduates pointed to their course work/program of studies (7 per cent), previous work in the industry (6 per cent), or simply a belief in themselves and their abilities (7 per cent).
Q13B. Why do you feel very prepared/somewhat prepared?
| 2017 | |
|---|---|
| From co-op/work-term/internship placement(s) | 31% |
| Still have a lot to learn about my discipline that can’t be learned in school | 8% |
| From coursework/program | 7% |
| Believe in self/my abilities | 7% |
| Not enough hands-on/practical training | 6% |
| Previous work/work in the industry | 6% |
| Coursework not related to real-world/courses outdated | 6% |
| Lack of work term(s)/co-op(s) | 5% |
| Don’t know what to expect/lack of insight into jobs | 4% |
| Well-rounded education | 4% |
| Missing specific courses/training from program | 4% |
| Other | 5% |
| Don't know | 18% |
BASE: Participants who feel very or somewhat prepared to enter the engineering workforce (n = 2,049).
Reasons for feeling unprepared
Among those who felt very or somewhat unprepared to enter the engineering workforce, three reasons tend to be mentioned most often: course work was not related to the ‘real-world’ or was outdated (20 per cent); they did not have a or have enough work term(s), co-op(s), or internship(s) (16 per cent); or their training was not hands-on/practical (15 per cent). Another nine per cent also mentioned that it is difficult to find a job, which may indicate that they may be prepared to work as an engineer, but their struggle to find a job may limit how prepared they feel.
Q13B. Why do you feel very unprepared/somewhat unprepared?
| 2017 | |
|---|---|
| Coursework not related to real-world/courses outdated | 20% |
| Lack of work term(s)/co-op(s) | 16% |
| Not enough hands-on/practical training | 15% |
| No jobs in industry/difficult to find a job | 9% |
| Concepts too general/lack of specialization | 5% |
| Don’t feel prepared/confident | 4% |
| No interest in pursuing a job as an engineer | 4% |
| Coursework focussed on grades/tests | 3% |
| Don’t know what to expect/lack of insight into jobs | 3% |
| Poor instruction/issues with faculty | 3% |
| Not enough focus on soft skills (e.g., speaking, teamwork, interpersonal) | 2% |
| Poor experiences in co-op/work term | 1% |
| Forget what was taught | 1% |
| Believe in self/my abilities | 1% |
| Missing specific courses/training from program | <1% |
| Other | 11% |
| Don't know | 16% |
BASE: Participants who feel very or somewhat prepared to enter the engineering workforce (n = 436).
Plans post-graduation
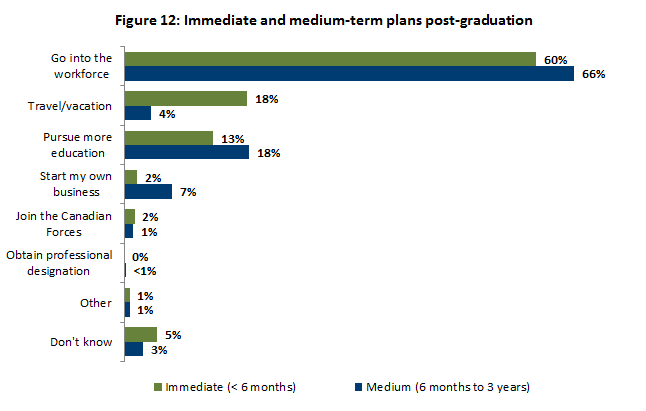
Post-graduation plans
The only noticeable difference between graduates’ immediate (within six months of graduating) and medium-term (six months to three years) plans are that slightly more expect to travel/vacation immediately following graduation, compared to medium-term plans (18 per cent versus four per cent). Otherwise, the most common plan is to go into the workforce (60 per cent immediate, 66 per cent medium-term).
While the majority in each age group plan on going into the workforce immediately after graduating, this increases as graduates get older (from 56 per cent among those 23 and younger to 75 per cent of those 27 and older). This tends to be primarily offset by older graduates being less likely to pursue more education (decreasing from 15 per cent for those 23 and under to six per cent for those older than 27). For medium-term plans, pursuing more education also decreases by age (from 20 per cent to 11 per cent), while starting my own business increases (from five per cent to 14 per cent).
Although immediate plans show little difference across the four regions, medium-term plans show some differences. For instance, those in Quebec are most likely to say they will start their own business (11 per cent versus five to six per cent), while those in Ontario are most likely to pursue more education (23 per cent versus 15 to 16 per cent).
Post-graduation education plans
Of the 24 per cent who reported plans to further their education either immediately after graduation or in the medium-term, they most commonly plan to pursue either a master’s degree (66 per cent) or doctorate degree (12 per cent) in engineering.
Compared to the past two years, there is a noticeable increase in the proportion who plan to pursue an MBA (20 per cent in 2017, compared to six per cent or fewer in the past two years). In part, this may be due to the fact that the question asked graduates about their immediate- and medium-term plans in 2017, but in the past two years has only asked about their immediate plans.
Q13. Which of the following best describes the education you plan to pursue?
| 2015 | 2016 | 2017 | |
|---|---|---|---|
| Pursue a master's degree in engineering | 66% | 79% | 66% |
| Pursue an MBA | 2% | 6% | 20% |
| Pursue a master's degree in another area of study (other than MBA or engineering) | 9% | 10% | 12% |
| Pursue a PhD in engineering | 7% | 10% | 12% |
| Pursue another professional degree (e.g., medicine, law, accounting, teaching) | 7% | 6% | 11% |
| Pursue a PhD in another area of study | 1% | 3% | 4% |
| Pursue another type of education | 2% | 3% | 3% |
| Don't know/unsure/no response | 6% | 1% | 4% |
Pursue a career in the field of engineering
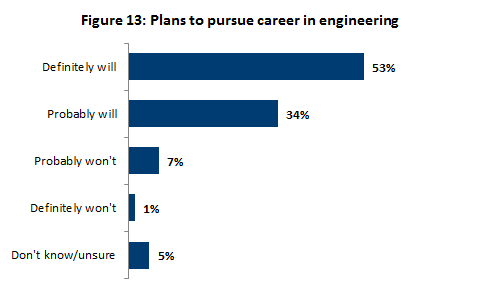
All graduates were asked if they plan to pursue a career in engineering once they complete their education. Almost nine in 10 think they will, with 53 per cent saying they definitely will.
Although it does not meet the threshold for statistical significance, it appears that older graduates are more likely than younger graduates to indicate that they will definitely pursue a career in the field of engineering, increasing from 50 per cent of those 23 and younger to 71 per cent of those 27 and older.
Career in engineering, over time
The proportion who definitely or probably will pursue a career in engineering fell below 90 per cent for the first time in 2017 (while it has ranged from 90 per cent to 95 per cent over the past four years).
Q14. When you complete your education, do you plan to pursue a career in the engineering field?
| 2013 | 2014 | 2015 | 2016 | 2017 | |
|---|---|---|---|---|---|
| Definitely will | 65% | 61% | 58% | 60% | 53% |
| Probably will | 30% | 31% | 32% | 30% | 34% |
| Probably won't | 4% | 6% | 5% | 3% | 7% |
| Definitely won't | 1% | 1% | 1% | 2% | 1% |
| Don't know/unsure | - | 5% | 4% | 5% | 5% |
Where they plan to work
Among those who plan to work in the engineering field, about seven in 10 plan to work in Canada, either in the province where they attended school (52 per cent) or elsewhere in the country (16 per cent). Just six per cent plan on working in the US and four per cent elsewhere in the world. These results have been very similar over the past three years.
Q17D. Where do you plan to work?
| 2015 | 2016 | 2017 | |
|---|---|---|---|
| In the province I'm attending school | 49% | 53% | 52% |
| Elsewhere in Canada | 16% | 14% | 16% |
| In the United States | 6% | 6% | 6% |
| Elsewhere in the world | 7% | 5% | 4% |
| Don't know/unsure | 22% | 22% | 21% |
BASE: Those who are definitely or probably pursuing a career in engineering (n = 2,165).
Graduates in the Atlantic region are much less likely than those in other regions to expect to work in the province in which they are attending school (29 per cent of Atlantic graduates compared to 53 to 57 per cent in other regions). Atlantic graduates are more likely to seek work elsewhere in Canada (40 per cent compared to 12 to 16 per cent in other regions). Also, graduates in Ontario are more than twice as likely to expect to work in the US (10 per cent versus three to four per cent in other regions).
Biggest challenge for those pursuing a career in engineering
When asked to identify the biggest challenge graduates will face early in their career, the most common challenge is a practical one: finding a job (26 per cent). Other job-related challenges are related to learning curves/learning new skills (10 per cent) and transitioning from school to work (nine per cent). Another nine per cent said their biggest challenge is having confidence in themselves.
Q17D1. What do you anticipate as the biggest challenge you will face in your early career?
| 2017 | |
|---|---|
| Finding a job | 26% |
| Learning curve/learning new skills | 10% |
| Transitioning from school to work environment | 9% |
| Confidence/proving myself | 9% |
| Lack of experience/technical skills | 6% |
| Figuring out career path | 3% |
| Financial/life stability | 3% |
| Work-life balance/relationships | 3% |
| Finding a job that is right for me | 2% |
| Gender/race discrimination | 1% |
| Other | 7% |
| Don't know | 24% |
Those in the Atlantic (39 per cent) and western (31 per cent) regions are more likely than those in Quebec (13 per cent) and Ontario (25 per cent) to indicate that finding a job is the biggest challenge they will face early in their career. Those in Quebec are about twice as likely as those in other regions to say the biggest challenge will be confidence/proving themselves (14 per cent versus seven to eight per cent in other regions).
Reasons for not pursuing a career in engineering
Those who indicated that they probably or definitely would not pursue a career in engineering, or were not sure, were asked for a reason. Most commonly, they reported that they are simply interested in other areas of work (31 per cent), engineering is not what they thought it would be (12 per cent), or that they are having trouble finding engineering-related work (10 per cent).
Q16. What is the primary reason you decided to pursue a career outside of engineering?
| 2013 | 2014 | 2015 | 2016 | 2017 | |
|---|---|---|---|---|---|
| I am interested in other areas of work | 7% | 7% | 12% | 34% | 31% |
| Engineering is not what I thought it was going to be | 27% | 38% | 31% | 13% | 12% |
| I am having trouble finding engineering-related work | - | - | 4% | 11% | 10% |
| I do not like the culture of the industry | - | - | 3% | 12% | 8% |
| Better employment opportunities in another field | 20% | 17% | 14% | 7% | 8% |
| Never intended to pursue a career in engineering | 16% | 12% | 18% | 5% | 8% |
| I would like to pursue another area of study | - | - | - | 4% | 8% |
| Opportunities to earn more money in another field | 13% | 10% | 6% | 7% | 6% |
| Not enough opportunities to positively influence world/community | - | - | - | - | 3% |
| Employment does not require engineering accreditation | - | - | - | 1% | 1% |
| Other | 7% | 8% | 9% | 5% | 5% |
BASE: Those who are definitely or probably not pursuing a career in engineering (n = 320).
Type of career pursuing instead of engineering
Those who do not plan to pursue a career in engineering or are unsure if they plan on pursuing an engineering career were asked in what area they planned to work. Most commonly, these graduates plan to work in industry (18 per cent), research (18 per cent), or government (14 per cent); however, many selected more than one area, indicating an overlap in many areas.
Q17. What type of career do you plan to pursue? Select all that apply.
| 2016 | 2017 | |
|---|---|---|
| Industry | 23% | 18% |
| Research | 17% | 18% |
| Government | 15% | 14% |
| Medicine | 10% | 12% |
| Marketing | 8% | 11% |
| Project management | 13% | 10% |
| Law/policy | 8% | 10% |
| Finance/banking | 7% | 9% |
| Start your own business | 16% | 8% |
| Management | 11% | 8% |
| Consulting | - | 7% |
| Business | 8% | 7% |
| Non-profit | 11% | 7% |
| Technology | - | 4% |
| Engineering | - | 3% |
| IT | 1% | 3% |
| Military | 2% | 3% |
| Construction | 1% | 3% |
| Software | 3% | 2% |
| Education | 2% | 2% |
| Architecture | - | <1% |
| Other | 19% | 11% |
| Not sure/unknown/no response | - | 7% |
BASE: Those who are definitely or probably not or unsure if pursuing a career in engineering (n = 320).
Job offers
In 2017, 43 per cent of graduates have received a job offer in the field of engineering, which is up from 37 per cent in 2016 and 38 per cent in 2015.
Those who have been offered a job in the field of engineering are more likely than those who have not been offered a job to say they absolutely feel like an engineer (56 per cent versus 40 per cent) or a leader (55 per cent versus 39 per cent).
Q17E. Have you already been offered a job(s) in the field of engineering?
| 2015 | 2016 | 2017 | |
|---|---|---|---|
| Yes | 38% | 37% | 43% |
| No | 62% | 63% | 57% |
Although it does not quite meet the threshold for statistical significance, those in the Atlantic (32 per cent) and western (38 per cent) regions are less likely than those in Quebec (54 per cent) and Ontario (43 per cent) to indicate they have been offered a job in the field of engineering.
Number of job offers
Among those who reported receiving a job offer, the average number of offers they have received is about two (1.9 offers) in 2017; however, the most common number of offers was one (52 per cent). The number of offers received is similar to 2016 (1.8 offers on average).
Q17F. How many jobs have you been offered in the field of engineering?
| 2015 | 2016 | 2017 | |
|---|---|---|---|
| One | 58% | 52% | 52% |
| Two | 25% | 29% | 28% |
| Three | 11% | 11% | 12% |
| Four | 3% | 5% | 4% |
| Five or more | 2% | 3% | 4% |
| Average number of job offers | 1.1 | 1.8 | 1.9 |
BASE: Those who received an engineering job offer.
Resources used to find engineering work
The most common resources used to find engineering work can be classified into four categories:
- On-campus resources: About 60 per cent use these resources, with on-campus student career services at the institution level (41 per cent) most commonly used.
- Mentors: About 52 per cent rely on mentors, most often a mentor from a co-op or internship (41 per cent).
- Online resources: About 35 per cent use online resources, with Indeed (19 per cent) and LinkedIn (11 per cent) being the most commonly mentioned websites.
- Family and friends: About 33 per cent rely on family or friends, although most predominantly on family (31 per cent).
Q17G. What resources have you used to find engineering work? Select all that apply.
| 2016 | 2017 | |
|---|---|---|
| On-campus | 61% | 60% |
| On campus, student career services (at the institution level) | 42% | 41% |
| On campus, student career services in the faculty/college of engineering | 30% | 29% |
| On campus, student career services in my department | 16% | 16% |
| Faculty in my department or other departments | 12% | 12% |
| Career fairs | - | 1% |
| Mentors | 49% | 52% |
| Mentors from co-op or internship experiences | 39% | 41% |
| Mentors from other work experiences | 21% | 19% |
| Role models | 9% | 10% |
| Online | 33% | 35% |
| Indeed | 18% | 19% |
| 7% | 11% | |
| Company websites | 5% | 6% |
| Monster | 2% | 2% |
| Glassdoor | 1% | 2% |
| Government job websites | - | 2% |
| Workopolis | 1% | 1% |
| Career Beacon | - | 1% |
| Other websites | 13% | 10% |
| Family/friends | 33% | 33% |
| Family | 31% | 31% |
| Friends/classmates | 2% | 3% |
| Other | 7% | 4% |
| I have not looked for engineering work | 9% | 10% |
There is very little difference across age groups in the resources they use to find engineering work. The only noticeable differences are that younger graduates tend to rely on family (34 per cent among graduates 23 and younger compared to 19 per cent among those 27 and older) and on-campus student career services at the institution level (decreasing from 42 per cent to 33 per cent) more than older graduates.
The only noticeable difference across regions is that Indeed is mentioned much less often in Quebec compared to other regions (seven per cent versus 20 to 26 per cent).
Plans to stay in Canada
Among those who are not permanent residents of Canada, 68 per cent plan on staying in Canada after their degree is completed, while 10 per cent plan on leaving Canada. These results are fairly consistent over the past three years.
Q36A. Do you plan on staying in Canada after your bachelor’s degree is completed?
| 2015 | 2016 | 2017 | |
|---|---|---|---|
| Yes | 62% | 71% | 68% |
| No | 16% | 10% | 11% |
| Unsure | 21% | 19% | 22% |
BASE: Those who are not a permanent resident of Canada (n = 124).
Licensure Plans
Professional activity
Professional engineering licensure
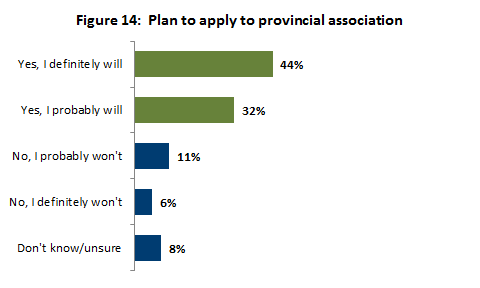
Slightly fewer than eight in 10 indicated that they definitely (44 per cent) or probably (32 per cent) will apply to their provincial association for licensure as a professional engineer (P.Eng.).
Although it just fails to meet the threshold for statistical significance, the older a graduate is, the more likely they are to say they definitely will be applying for licensure as a professional engineer (P.Eng.), increasing from 40 per cent of those 23 and younger to 61 per cent of those 27 and older.
Licensure, over time
The proportion who definitely will be applying to their provincial association declined from 50 per cent in 2016 to 44 per cent in 2017, which is the lowest proportion over the past five years.
Q21. Do you intend to apply to your provincial association for licensure as a Professional Engineer (P.Eng.)?
| 2013 | 2014 | 2015 | 2016 | 2017 | |
|---|---|---|---|---|---|
| Definitely will | 55% | 49% | 46% | 50% | 44% |
| Probably will | 28% | 30% | 30% | 29% | 32% |
| Probably won't | 8% | 9% | 12% | 9% | 11% |
| Definitely won't | 3% | 4% | 4% | 4% | 6% |
| Don't know/unsure | 7% | 9% | 9% | 9% | 8% |
Reasons for not applying
Those who do not intend on applying for their licensure said it is because they don’t need it to work in their field (30 per cent) or they plan on applying for it in a different province than the one they studied in (26 per cent).
Q23. Why do you not intend to apply for licensure as a Professional Engineer (P.Eng.)?
| Don't need it/field I'm in doesn't benefit me | 30% |
|---|---|
| Apply for licence in other province/work in other province | 26% |
| Unsure/will not work in the field | 19% |
| Work outside of the country | 9% |
| Cost/too expensive | 3% |
| Don't have a P.Eng. I can work under/can't get the required experience | 7% |
| Only if I have to | 1% |
| Too much time/effort | 4% |
| Too much responsibility to maintain | 2% |
| Other | 7% |
| Don't know/no response | 2% |
BASE: Those who do not intend to apply for their provincial association for licensure (n = 410).
Where graduates will apply for licensure
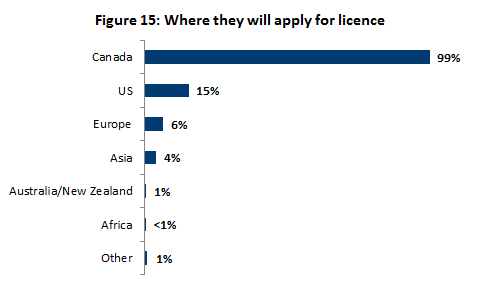
Of those who are likely to apply for licensure, almost all (99 per cent) said they would do so in Canada. However, many reported that they may also apply in other jurisdictions, especially the US (15 per cent), Europe (six per cent), or Asia (four per cent).
BASE: Those who do intend to apply for a P.Eng. licence (n = 2,078).
Where will apply for licensure, over time
Results in 2017 are on par with 2016 in terms of where graduates expect to apply for licensure.
Q25. Where do you intend to apply for licensure?
| 2016 | 2017 | |
|---|---|---|
| Canada | 99% | 99% |
| US | 17% | 15% |
| Europe | 7% | 6% |
| Asia | 4% | 4% |
| Australia/New Zealand | <1% | <1% |
| Africa | <1% | <1% |
| Other | 1% | 1% |
BASE: Those who do intend to apply for a P.Eng. licence (n = 2,078).
Those in the Atlantic region (nine per cent) tend to be less likely to intend to apply to the US than those in Ontario (19 per cent), the western region (15 per cent), or Quebec (13 per cent). However, there is virtually no difference in applying within Canada, as 99 per cent in each region plan to do so.
Understanding of licencing roles and requirements
Licencing practices
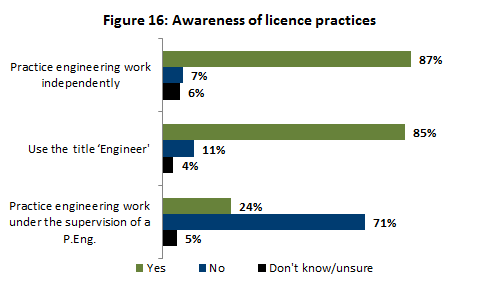
Most graduates correctly identified that a professional engineers’ licence is required for the following:
- to practise engineering work independently (87 per cent)
- to use the title “Engineer” (85 per cent)
Further, most graduates (76 per cent) also correctly identified that a professional engineering licence is not required to practise engineering work under the supervision of a P.Eng.
BASE: Those who do intend to apply for a P.Eng. licence (n = 2,078).
Graduates aged 23 or younger (20 per cent) are less likely than those aged 24 to 26 (34 per cent) or 27 and older (33 per cent) to say that a professional engineering licence is required to practise engineering work under the supervision of a P.Eng.
Graduates in Quebec (95 per cent) and Ontario (87 per cent) are more likely than those in the Atlantic (77 per cent) and western (77 per cent) regions to know that a licence is required before using the title ‘Engineer.’ In addition, those in Quebec (37 per cent) are more likely than those in other regions (16 per cent to 24 per cent) to say that a professional engineering licence is required to practice engineering work under the supervision of a P.Eng.
Awareness score
As shown in the figure below, 55 per cent of the respondents received a high (perfect) score, answering all three statements correctly (that is, a licence is required to practice engineering work independently and to use the title engineer, but not to practise engineering work under the supervision of a P.Eng.), while 35 per cent answered two of the three questions correctly.
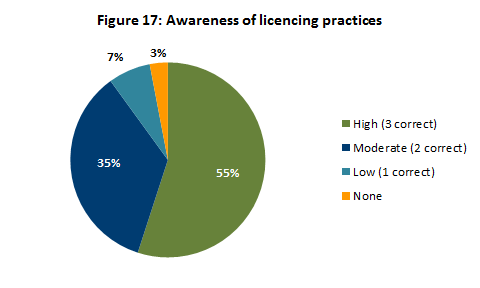
BASE: Those who do intend to apply for a P.Eng. licence (n = 2,078).
Graduates in Ontario (62 per cent) and the Atlantic (59 per cent) region are more likely to receive a perfect score for the three questions compared to those in the western (52 per cent) region or in Quebec (49 per cent).
Licencing practices, over time
Compared to previous years, graduates are about equally as likely to correctly say that a licence is required to practise engineering work independently and to use the title ‘Engineer', and more likely to incorrectly say it is required to practise engineering work under the supervision of a P.Eng.
Q8. As far as you know, is a professional engineers' licence required before being able to…
| 2013 | 2014 | 2015 | 2016 | 2017 | |
|---|---|---|---|---|---|
| Practice engineering work independently | 85% | 85% | 85% | 84% | 87% |
| Use the title “Engineer” | 75% | 74% | 72% | 77% | 85% |
| Practice engineering work under the supervision of a P.Eng. | 20% | 17% | 13% | 19% | 24% |
7Score, over time
The proportion of graduates who answered all three statements correctly reached its highest point in 2017, though this number has remained fairly consistent over time.
Q8. As far as you know, is a Professional Engineers' licence required before being able to…
| Requirements score | 2013 | 2014 | 2015 | 2016 | 2017 |
|---|---|---|---|---|---|
| High (3 correct) | 47% | 50% | 53% | 52% | 55% |
| Moderate (2 correct) | 42% | 40% | 36% | 38% | 35% |
| Low (1 correct) | 8% | 7% | 8% | 8% | 7% |
| None (0 correct) | 3% | 3% | 3% | 3% | 3% |
Licencing roles
Most respondents correctly indicated that the provincial association is responsible for the following:
- licencing professional engineers (91 per cent)
- regulating the practice of professional engineering (80 per cent)
- promoting the interests of professional engineers (73 per cent)
- licencing companies offering engineering services to the public (60 per cent)
Most respondents (87 per cent) also correctly indicated that Engineers Canada is responsible for accrediting post-secondary institution engineering programs.
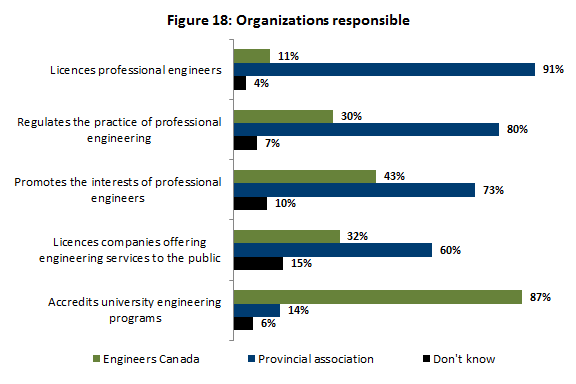
BASE: Those who do intend to apply for a P.Eng. licence (n = 2,078).
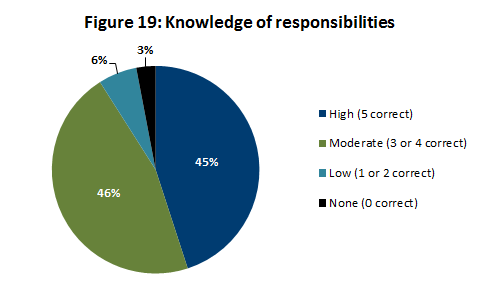
Knowledge score
Almost half of graduates (45 per cent) have high knowledge scores, correctly identifying the organization that is responsible in all five cases.[3] A similar proportion (46 per cent) have moderate knowledge, correctly identifying the organization responsible for three or four of these activities.
Results over time
Over time, there have been slight fluctuations in graduates’ knowledge of Engineers Canada’s role and the provincial associations’ roles.
Q9. Please indicate the organization(s) responsible for the following activity/procedure:
| 2013 | 2014 | 2015 | 2016 | 2017 | |
|---|---|---|---|---|---|
| Provincial association | |||||
| Licences professional engineers | 90% | 90% | 90% | 91% | 91% |
| Regulates the practice of professional engineering | 83% | 80% | 80% | 83% | 80% |
| Promotes the interests of professional engineers | 70% | 69% | 75% | 77% | 73% |
| Licences companies offering engineering services | 50% | 53% | 55% | 60% | 60% |
| Accredits post-secondary institution engineering programs | 25% | 20% | 11% | 12% | 14% |
| Engineers Canada | |||||
| Licences professional engineers | 11% | 9% | 9% | 11% | 11% |
| Regulates the practice of professional engineering | 27% | 26% | 25% | 26% | 30% |
| Promotes the interests of professional engineers | 44% | 48% | 40% | 41% | 43% |
| Licences companies offering engineering services | 32% | 30% | 32% | 30% | 32% |
| Accredits post-secondary institution engineering programs | 70% | 74% | 87% | 88% | 87% |
Student knowledge of the organizations responsible for professional engineering was increasing over time; however, results are virtually unchanged in 2017 from 2016, with 45 per cent answering all five correctly in 2017 compared to 46 per cent last year.
Q9. Please indicate the organization(s) responsible for the following activity/procedure:
| 2013 | 2014 | 2015 | 2016 | 2017 | |
|---|---|---|---|---|---|
| High (5 correct) | 33% | 37% | 44% | 46% | 45% |
| Moderate (3 or 4 correct) | 56% | 54% | 48% | 46% | 46% |
| Low (1 or 2 correct) | 6% | 5% | 4% | 5% | 6% |
| None (0 correct) | 4% | 4% | 4% | 3% | 3% |
Note: Due to rounding, columns may not sum to 100 per cent.
[1] This yields a margin of error of approximately ±1.9 per cent for data presented at the national level.
[2] Engineers Canada prepares a report outlining enrolment and graduation trends from accredited engineering programs across Canada. The report can be found on the Engineers Canada website (https://engineerscanada.ca/reports/canadian-engineers-for-tomorrow).
[3] To count as correct, a respondent could identify either the provincial association or Engineers Canada as responsible for promoting the interests of professional engineers; they did not have to identify both.