Trends in Engineering Enrolment and Degrees Awarded 2013-2017
Message from the Chief Executive Officer

Engineers Canada is pleased to publish this year’s enrolment and degrees awarded report highlighting trends in post-secondary engineering education in Canada. This document comprises information on all academic terms from the calendar years 2013 through 2017.
Canadian post-secondary institutions continue to report a strong growth in undergraduate degrees awarded, presenting 23.3 per cent more engineering degrees in 2017 than in 2013. It is reassuring to see that every engineering discipline awarded more degrees in 2017 than in 2013, and that most engineering disciplines have experienced a growth in undergraduate enrolment numbers in the same period.
We are excited to report that the proportion of female students established new records in the categories of undergraduate and post-graduate enrolment, as well as undergraduate degrees awarded. As of 2017, women accounted for 21.8 per cent of undergraduate students and 25.7 per cent of post-graduate students, as well as 20.6 per cent of undergraduate engineering degrees awarded. We hope that these achievements will inspire engineering education and the engineering profession to break new records in the years to come.
Canadian engineering programs remain a popular choice for international students. In 2017, the number of undergraduate students reached 13,474 or 16.3 per cent of the total.
For the third consecutive year, Engineers Canada collected data regarding Indigenous students’ enrolment and degrees awarded. Similar to the female population in engineering programs, Indigenous peoples are still greatly underrepresented, accounting for just over 1.2 per cent of reported undergraduate students. This is around four times lower than the 4.9 per cent of Canadians who identify as Indigenous peoples (Statistics Canada, 2017).
Engineers Canada will continue to track this information in the coming years to identify trends and to further encourage enrolment and achievement by post-secondary engineering programs that reflect Canada’s diversity.
Gerard McDonald, MBA, P.Eng.
Chief Executive Officer
Acknowledgements
Engineers Canada gratefully acknowledges the contribution of data and information from the deans and associate deans of the engineering and applied science faculties at Canadian higher education institutions.
Cover Image Credit: Mikael Kristenson
Report By: Vinicius Rossi
Introduction
The Engineering Enrolment and Degrees Awarded Report is an annual examination of Canada's undergraduate and post-graduate engineering programs that evaluates trends in part- and full-time student enrolment and degrees awarded over a five-year period. In 2017, 51 universities provided information on their enrolment, programs, and degrees awarded.
The results highlight enrolment trends by discipline and institution, as well as the number of undergraduate and post-graduate degrees awarded each year. These results reveal trends specific to discipline, education, and gender, as well as the number of engineering graduates available to enter the labour market, international students’ participation in Canadian engineering education, and students studying in co-op programs. Enrolment trends in undergraduate, master’s, and doctorate levels are compared, along with men and women studying and graduating from engineering programs. For the third consecutive year, data regarding Indigenous peoples’ enrolment and graduation from engineering programs is presented in this report. Engineers Canada plans to continue this data collection in coming years to be able to identify emerging trends.
Data is provided by higher education institutions to Engineers Canada. Engineers Canada compiles the information in this report. Findings are then shared with Engineers Canada’s stakeholders and with the public. Engineers Canada greatly appreciates the contribution of these higher education institutions.
NOTE: When comparing data between years, only those higher education institutions who consistently responded to the survey year after year are included in the comparison. If an institution did not provide data in one or more of those years, they were not included in the comparison. This was done to ensure that the comparisons are fair and are as accurate as possible.
Undergraduate students
Total undergraduate student enrolment
Undergraduate student enrolment in accredited engineering programs totalled 82,480 in 2017. This is an increase of 14.4 per cent from 2013 and no significant change from 2016 was observed.
If engineering programs seeking accreditation—but not yet accredited—are included in the sum, total undergraduate enrolment rises to 83,953 students. Chart 1.1 illustrates undergraduate enrolment numbers for engineering institutions that consecutively replied to this survey since 2013.
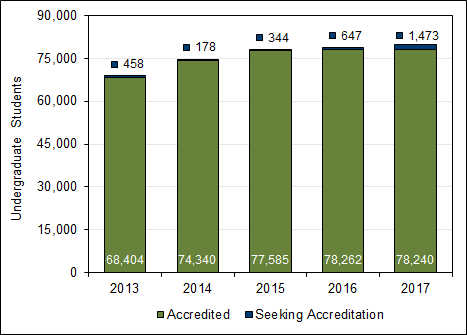
(2013-2017, full-time equivalent)
Total undergraduate student enrolment by discipline
The most popular undergraduate engineering disciplines in 2017 were mechanical engineering, civil engineering, and electrical engineering, representing 22.1 per cent, 14.1 per cent, and 13.6 per cent of total undergraduate enrolment, respectively. On the other hand, the fields that accounted for the smallest proportion of undergraduate enrolment were geological engineering (0.8 per cent), materials or metallurgical engineering (1.1 per cent), and mining or mineral engineering (1.2 per cent).
Computer engineering (12.1 per cent), environmental engineering (11.2 per cent), and software engineering (8.9 per cent), presented the highest growth rate over the previous year. Likewise, the disciplines that experienced the largest cumulative growth from 2013 were software engineering (67.8 per cent), biosystems engineering (67.1 per cent), and computer engineering (56.7 per cent). Conversely, mining or mineral engineering (-22.5 per cent), geological engineering (-12.4 per cent), and materials or metallurgical engineering (-7.3 per cent) had the greatest rate of decline from the previous year. Additionally, only three disciplines presented a decline in enrolment since 2013: mining or mineral engineering (-25.8 per cent), geological engineering (-10.5 per cent), and materials or metallurgical engineering (-3.6 per cent). Once again, these comparisons were made between institutions that consecutively replied to the enrolment and degrees awarded survey since 2013.
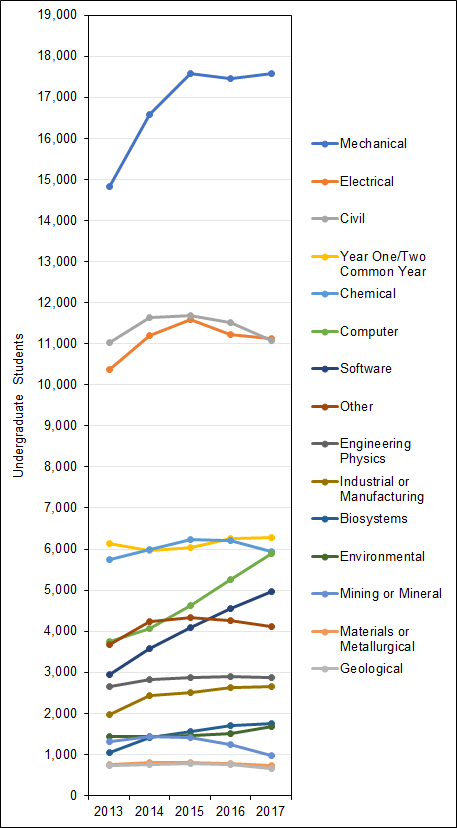
(2013-2017, full-time equivalent)
Total undergraduate student enrolment by province
The highest proportion of undergraduate enrolment continues to belong to the provinces of Ontario and Quebec. In 2017, they accounted for 44.2 per cent and 25.6 per cent of total enrolment, respectively. Furthermore, Nova Scotia and Alberta underwent the largest percentage increase in enrolment from the previous year, with growths of 3.9 per cent and 2.6 per cent, respectively, over 2016.
The highest cumulative enrolment growths from 2013 were seen in Nova Scotia (28.7 per cent) and Ontario (22.9 per cent). On the other hand, New Brunswick (-15.0 per cent) and Alberta (-1.8 per cent) were the only provinces to experience a decrease in enrolment since 2013, while New Brunswick (-7.6 per cent), Saskatchewan (-3.0 per cent), and Quebec (-2.4 per cent) were the only ones to experience a decrease from the previous year.
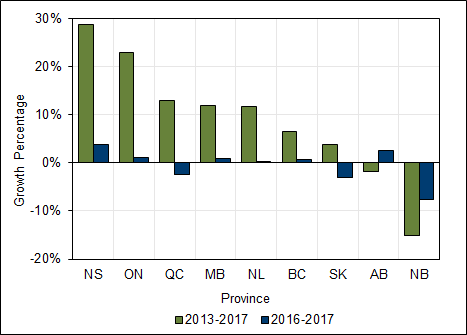
(2013-2017, 2016-2017, full-time equivalent)
Total undergraduate degrees awarded
The number of undergraduate degrees awarded totalled 15,782 in 2017. The number of undergraduate degrees awarded increased by 7.3 per cent from the previous year, characterizing a faster growth when compared to the average annual increase of 5.4 per cent for the period of 2013 to 2017. Cumulatively, the number of degrees awarded has increased 23.3 per cent from 2013. Once again, these comparisons were made between institutions that consecutively replied to the enrolment and degrees awarded survey since 2013.
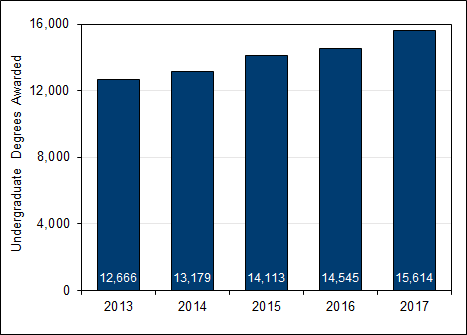
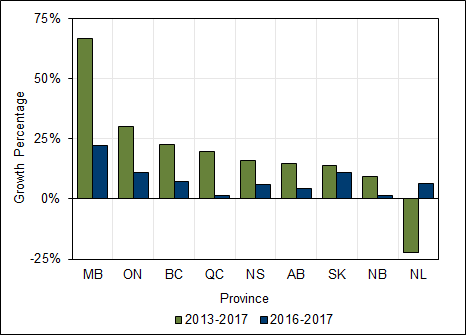
Chart 1.5 shows that Manitoba, Ontario, and Saskatchewan witnessed the highest increases in undergraduate degrees awarded from 2016, with growths of 22.4 per cent, 11.2 per cent, and 10.8 per cent, respectively. Similarly, Manitoba, Ontario, and British Columbia experienced the highest increases in undergraduate degrees awarded from 2013, with growths of 66.8 per cent, 30.3 per cent, and 22.5 per cent, respectively.
No provinces experienced decreases in undergraduate degrees awarded from the previous year, while Newfoundland and Labrador was the only province to experience a cumulative decrease in undergraduate degrees awarded from 2013 (-22.2 per cent).
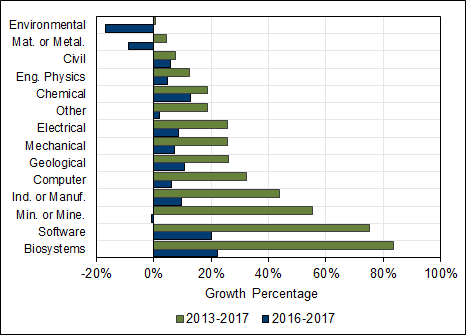
Mechanical engineering, civil engineering, and electrical engineering were awarded the greatest number of degrees in 2017, representing 25.3 per cent, 18.0 per cent, and 16.3 per cent of the total, respectively. Furthermore, biosystems engineering exhibited the largest growth in degrees awarded from both 2016 (22.4 per cent) and 2013 (83.6 per cent).
Even though environmental engineering (-16.8 per cent), materials or metallurgical engineering (-8.9 per cent), and mining or mineral engineering (-0.9 per cent) were the only disciplines to display decreases since 2016 in the number of undergraduate degrees awarded, every discipline saw an increase from 2013.
Graduate students
Total graduate student enrolment
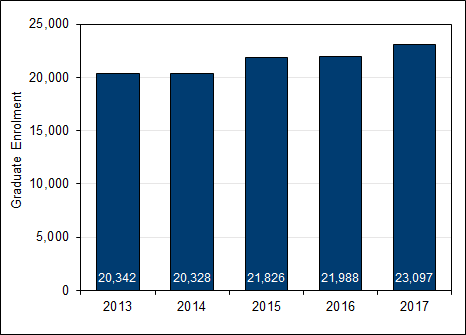
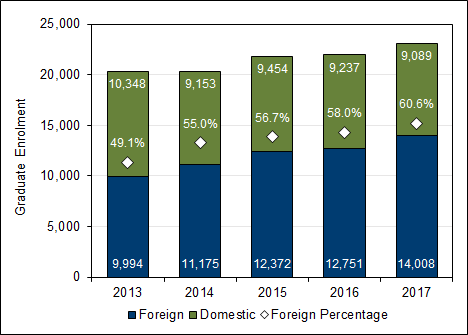
Graduate student enrolment totalled 23,992 in 2017. When comparing institutions that consecutively replied to this survey since 2013, graduate student enrolment increased by 5.0 per cent from 2016 and 13.5 per cent from 2013, averaging a 3.3 per cent annual growth rate.
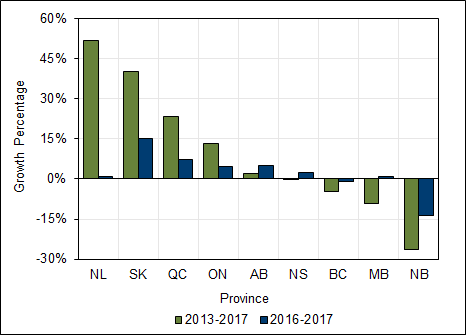
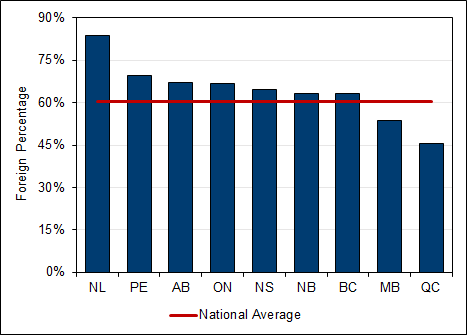
The province that displayed the highest growth in graduate enrolment over the previous year was Saskatchewan (15.2 per cent), while the one that displayed the highest cumulative growth since 2013 was Newfoundland and Labrador (51.8 per cent). The greatest decrease from both 2016 and 2013 was observed in New Brunswick at -13.6 per cent and -26.5 per cent, respectively.
Total post-graduate degrees awarded
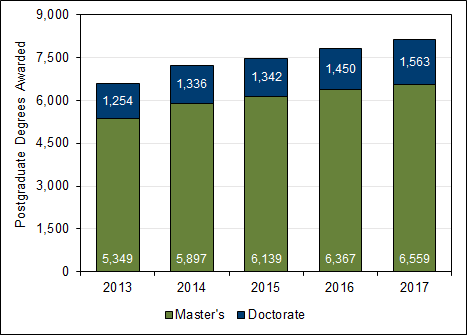
A total of 6,844 master's and 1,713 doctorate of engineering degrees were awarded in 2017, for a combined sum of 8,557 post-graduate degrees awarded. This corresponds to a growth of 3.0 per cent in master's degrees awarded and 7.8 per cent in doctoral degrees awarded from 2016. Similarly, a cumulative growth of 22.6 per cent in master’s degrees awarded and 24.6 per cent in doctoral degrees awarded was seen from 2013.
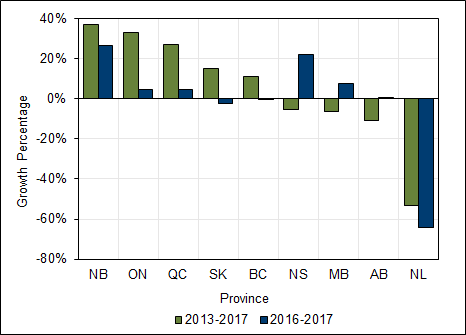
New Brunswick displayed the fastest growth in the number of post-graduate degrees awarded from both 2016 (21.6 per cent) and 2013 (36.8 per cent).
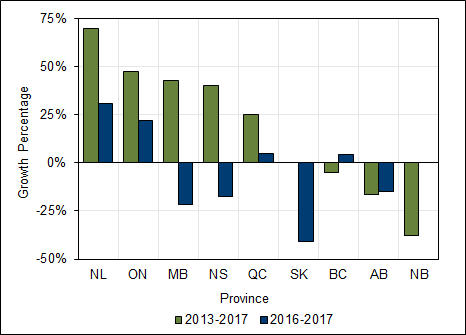
Chart 1.10 indicates the average growth in master's degrees awarded by province for the periods of 2013 to 2017 and 2016 to 2017, while chart 1.11 indicates the same trends for doctoral degrees.
Female students
Female undergraduate enrolment
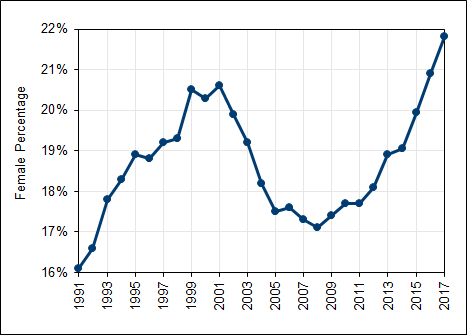
Female enrolment remained above 20 per cent in 2017, with a 0.9 percentage point increase from 20.9 per cent in 2016 to 21.8 per cent in 2017. This is the highest proportion of females enrolled in undergraduate engineering programs ever recorded by this report. The total number of females enrolled in undergraduate-level engineering programs has increased by 3.7 per cent since 2016 and 32.2 per cent since 2013.
Female undergraduate enrolment by discipline
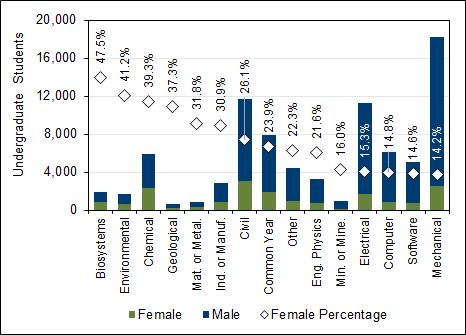
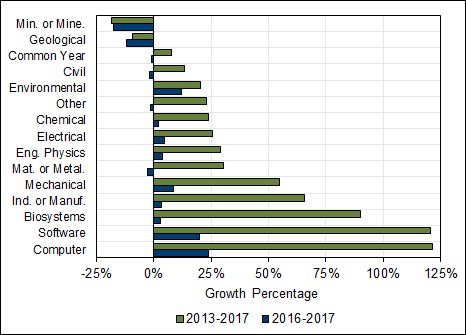
The disciplines that presented the highest percentages of female undergraduate enrolment in 2017 were biosystems engineering, environmental engineering, and chemical engineering, with 47.5 per cent, 41.2 per cent, and 39.3 per cent of total enrolment, respectively. Four out of the five disciplines with the highest percentage of females enrolled were also four out of the five disciplines with the least number of undergraduate students enrolled (see Chart 2.2).
The disciplines with the lowest percentages of female undergraduate enrolment were mechanical engineering (14.2 per cent), software engineering (14.6 per cent), and computer engineering (14.8 per cent). While these three disciplines account for 55.1 per cent of the total number of undergraduate students, they only account for 23.5 per cent of the total number of female undergraduate students.
Furthermore, the disciplines that presented the highest growth in the proportion of females from 2016 were chemical engineering and materials or metallurgical engineering, which rose from 36.8 per cent and 31.6 per cent in 2016, to 39.3 per cent and 33.1 per cent in 2017, respectively. Similarly, the disciplines that presented the highest growth in the proportion of females from 2013 were again materials and metallurgical engineering and chemical engineering, which went from 24.5 per cent and 32.8 per cent in 2013, to 33.1 per cent and 39.3 per cent in 2017, respectively.
Female undergraduate enrolment by province
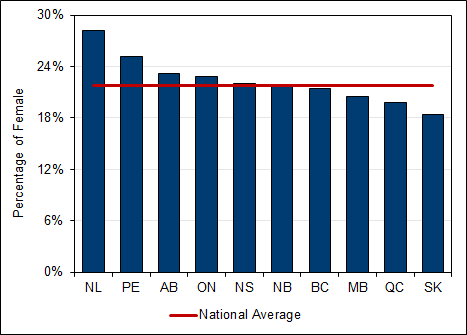
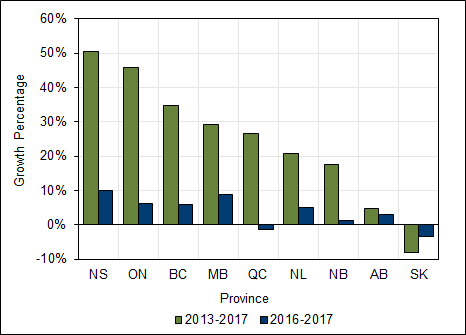
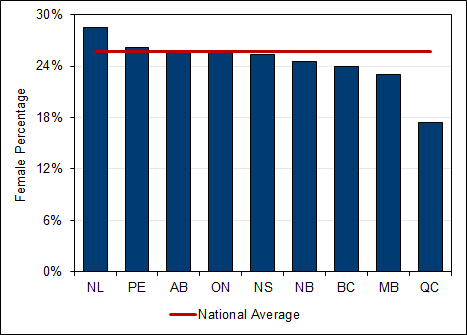
Newfoundland and Labrador had the highest percentage of female undergraduates (28.2 per cent), while Saskatchewan displayed the lowest percentage of female enrolment in 2017, with only 18.5 per cent in the undergraduate engineering student population. Seven out of the nine provinces considered experienced increases in female undergraduate enrolment from 2016, while eight out of these same nine provinces experienced increases from 2013.
Female undergraduate degrees awarded
Of the 15,782 engineering degrees awarded in 2017, 3,244 were awarded to women, accounting for 20.6 per cent of the sampled population. When comparing engineering programs that consecutively replied to this survey, increases of 11.9 per cent from 2016 and 34.7 per cent from 2013 were observed. Furthermore, this proportion is not suggestive of any significant gender differences in completion rates when compared to the 20.1 per cent average proportion of women in undergraduate enrolment over the past five years.
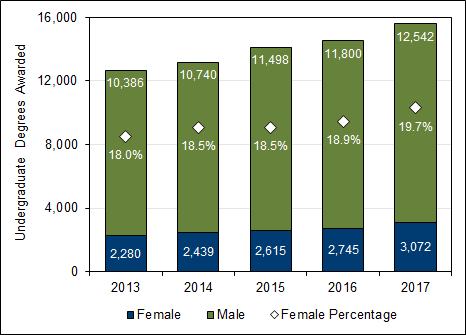
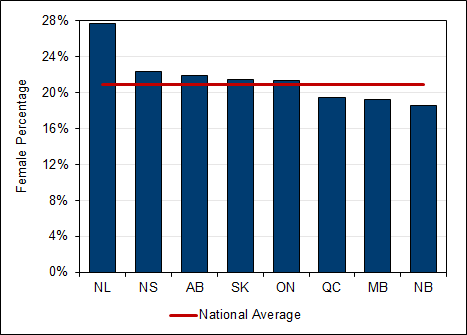
The province with the highest proportion of female undergraduate degrees awarded was Newfoundland and Labrador (27.6 per cent), followed by Nova Scotia (22.3 per cent), and Alberta (21.9 per cent). Moreover, Newfoundland and Labrador had the greatest increase in the proportion of female undergraduate degrees awarded when compared to 2016, with a growth of 10.4 percentage points overall.
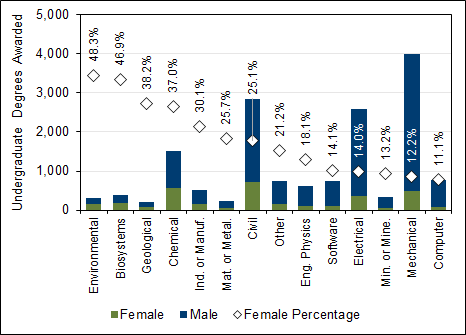
The disciplines that had the highest growth over the previous year in the proportion of female undergraduate degrees awarded were that of environmental engineering (8.7 percentage points, going from 39.7 per cent in 2016 to 48.3 per cent in 2017) and biosystems engineering (3.3 percentage points, going from 42.5 per cent in 2016 to 45.8 per cent in 2017). Likewise, the categories that presented the highest growth from 2013 were that of environmental engineering (8.0 percentage points, going from 40.3 per cent in 2013 to 48.3 per cent in 2017) and industrial or manufacturing engineering (7.5 percentage points, going from 20.3 per cent in 2013 to 27.8 per cent in 2017).
The proportion of female undergraduate degrees awarded should experience a consistent growth in the coming years to the cumulative increase in the proportion of female undergraduate enrolment in many disciplines, as illustrated in Chart 2.3. This should be especially reflected in the disciplines of environmental engineering, industrial or manufacturing engineering, and chemical engineering.
Female graduate student enrolment
The proportion of females enrolled in post-graduate engineering programs continues to grow, reaching 25.7 per cent in 2017. When comparing institutions that consistently replied to this survey since 2013, an increase in proportion of 0.7 percentage points from 2016 and 2.1 percentage points from 2013 was observed.
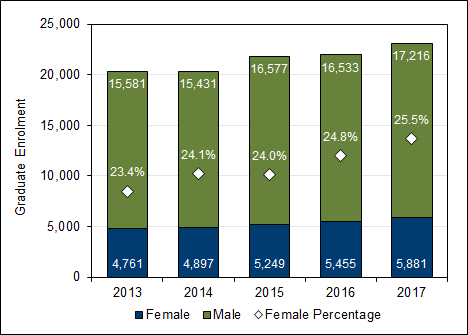
The highest proportions of female post-graduate enrolment in 2017 were seen in Alberta, British Columbia, and Quebec, with values of 28.5 per cent, 26.1 per cent, and 25.8 per cent, respectively.
Female post-graduate degrees awarded
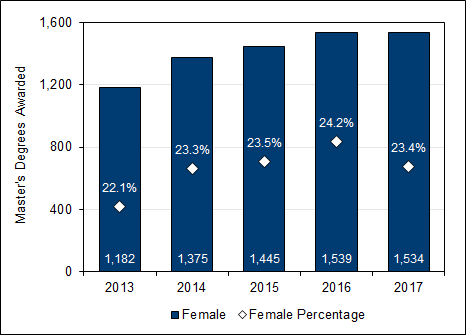
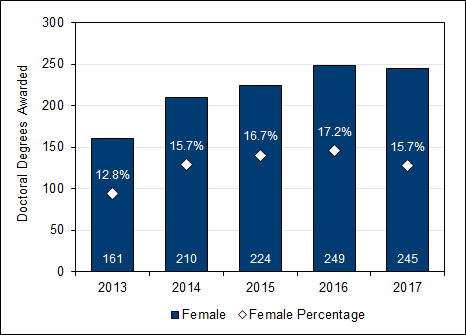
The number of post-graduate degrees awarded to women in 2017 consisted of 1,740 master’s degrees and 401 doctoral degrees. When compared to 2016, this represented no significant changes in the number of master's degrees awarded or doctoral degrees awarded. However, when comparing institutions that consistently replied to this survey since 2013, the proportion of master's degrees awarded to women has decreased from 24.2 per cent in 2016 to 23.4 per cent in 2017, while the proportion of doctoral degrees awarded to women went from 17.2 per cent in 2016 to 15.7 per cent in 2017.
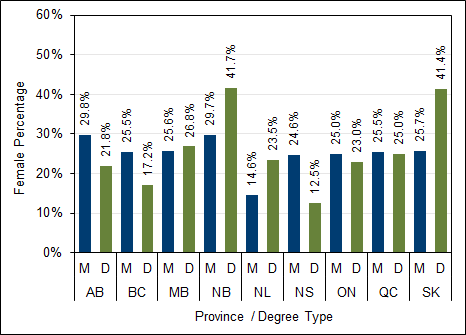
In 2017, the province with the largest percentage of master’s degrees awarded to women was Alberta, at 29.8 per cent, while New Brunswick had the greatest percentage of women receiving doctoral degrees, at 41.7 per cent. Conversely, Manitoba had the smallest percentage of master’s degrees awarded to women (14.6 per cent), while Nova Scotia displayed the smallest proportion of women who received doctoral degrees (12.5 per cent).
Foreign students
Foreign undergraduate enrolment
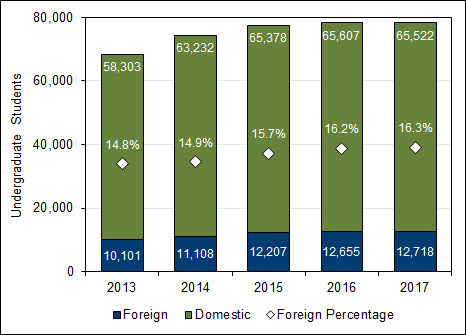
There were 13,474 international students enrolled in undergraduate engineering programs in 2017, accounting for 16.3 per cent of total enrolment. When comparing institutions that consecutively replied to this survey since 2013, foreign undergraduate enrolment increased by 0.5 per cent from the previous year, when international students corresponded to 16.2 per cent of total undergraduate enrolment, and 12.4 per cent from 2013, when international students corresponded to 14.8 per cent of total undergraduate enrolment.
Foreign undergraduate enrolment by discipline
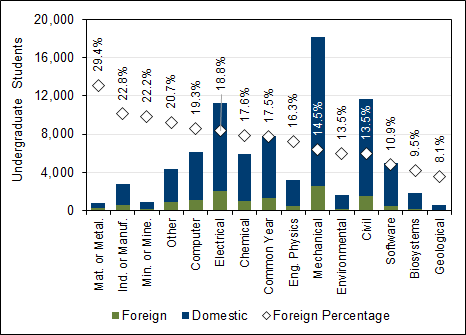
Materials or metallurgical engineering and industrial or manufacturing engineering had the highest proportion of foreign students enrolled, at 29.4 per cent and 22.8 per cent, respectively. Conversely, the programs that displayed the lowest proportion of international students were geological engineering (8.1 per cent) and biosystems engineering (9.5 per cent).
Foreign undergraduate enrolment by province
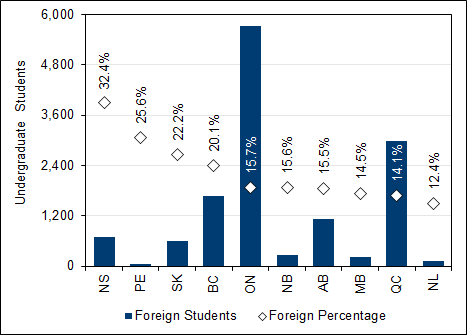
Out of the 13,474 international students enrolled in undergraduate engineering programs in Canada in 2017, 42.5 per cent (5,729) studied in Ontario and 22.1 per cent (2,973) studied in Quebec. Prince Edward Island and Nova Scotia displayed the highest proportion of international students enrolled at 10.0 per cent (61 students) and 6.5 per cent (692 students), respectively. The largest growth in international student enrolment over the previous year was found in Nova Scotia (13.2 per cent) and Newfoundland and Labrador (10.6 per cent).
Visa undergraduate degrees awarded
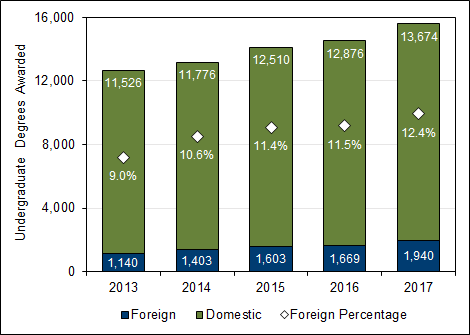
In 2017, 2,228 of the 15,774 undergraduate degrees were awarded to foreign students, representing 14.1 per cent overall. When comparing institutions that consecutively replied to this survey since 2013, the proportion of degrees awarded to international students experienced a growth of 0.9 percentage points from 2016 and 3.4 percentage points from 2013.
Foreign graduate student enrolment
Foreign post-graduate degrees awarded
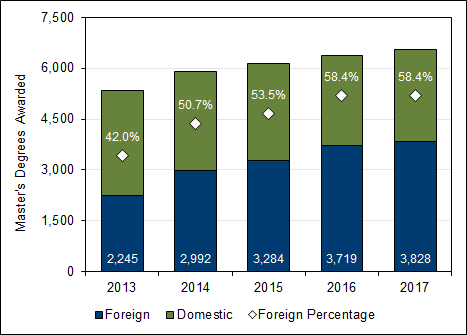
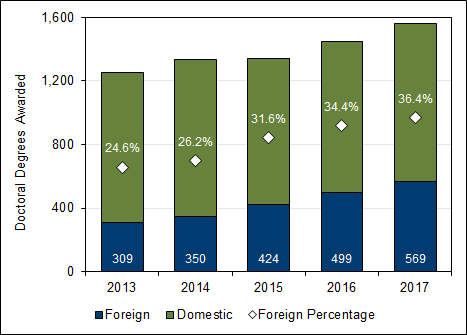
In 2017, the number of master's degrees awarded to foreign students totalled 4,059 while the number of doctoral degrees awarded totalled 861. When comparing institutions that consecutively replied to this survey, visa master’s degrees awarded to foreign students increased by 2.9 per cent over the previous year and 70.5 per cent from 2013, while doctoral degrees awarded increased by 14.0 per cent over the previous year and 84.1 per cent from 2013.
The proportion of post-graduate degrees awarded to foreign students reached 59.3 per cent of all master's degrees and 50.3 per cent of all doctoral degrees in 2017. This represents a large growth from 2013, when the proportion of master's was 43.1 per cent and that of doctoral degrees was 27.2 per cent.
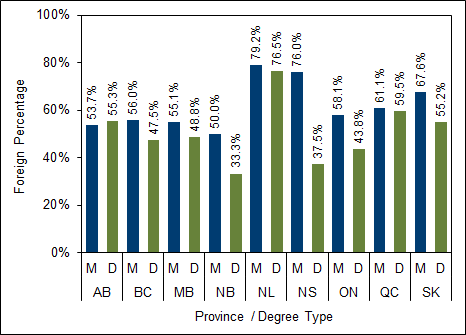
In 2017, Newfoundland and Labrador, Nova Scotia, and Saskatchewan had the greatest proportion of master's degrees awarded to visa students (79.2 per cent, 76.0 per cent, and 67.6 per cent, respectively). Similarly, Newfoundland and Labrador, Quebec, and Alberta awarded the greatest proportion of their doctoral degrees to visa students at 76.5 per cent, 59.5 per cent, and 55.3 per cent, respectively.
Indigenous peoples’ enrolment and degrees awarded
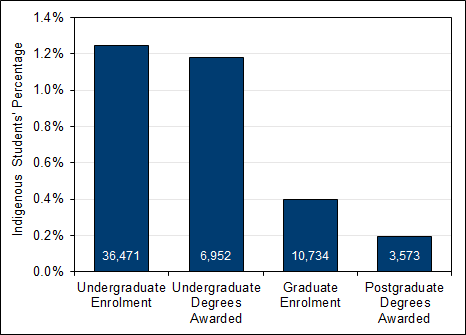
Out of the 23 post-secondary institutions that responded to this survey about Indigenous peoples, 22 institutions were able to provide information on Indigenous peoples' undergraduate enrolment, while only 20 were able to provide information on undergraduate degrees awarded. The 22 institutions represent 44.2 per cent of undergraduate students enrolled in engineering programs across Canada, while the 20 post-secondary institutions represent 44.1 per cent of undergraduate degrees awarded. Furthermore, 20 institutions were able to present data on Indigenous enrolment in graduate programs, with only 18 of them presenting data on post-graduate degrees awarded. These 20 institutions represent 44.7 per cent of post-graduate students in Canada, whereas the 18 post-secondary institutions represent 41.8 per cent of post-graduate degrees awarded. As the reported numbers are of small magnitude, the data on Indigenous student enrolment is presented in a cumulative form to assure anonymity. While not all institutions are able to report the Indigenous identity of their students, Engineers Canada believes this data allows the engineering community to pursue conversations on increasing the representation of Indigenous peoples in engineering. Even if we cannot currently achieve a comprehensive and true representation of Indigenous peoples' enrolment and degrees awarded, this provides us with an important starting point.
While Indigenous peoples make up 4.9 per cent of the Canadian population (Statistics Canada, 2017), they only account for 1.2 per cent of total undergraduate enrolment in engineering programs and 1.2 per cent of undergraduate degrees awarded. Graduate student enrolment demonstrated lower enrolment of Indigenous peoples, at 0.4 per cent of total enrolment, while graduate degrees awarded represented 0.2 per cent of surveyed students.
Faculty members
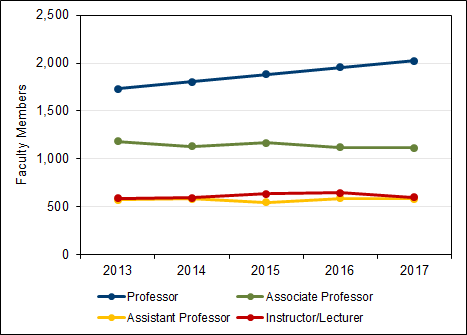
There was a total of 3,990 full-time equivalent engineering faculty members in 2017. When comparing institutions that consecutively replied to this survey since 2013, the number of full-time equivalent faculty members remained nearly constant from 2016 and increased by 5.9 per cent from 2013.
The percentage of female faculty members has increased from 13.4 per cent in 2013 and 14.9 per cent in 2016, to 15.5 per cent in 2017. The faculty position with the highest percentage of females was that of assistant professors (23.0 per cent), whereas the position with the lowest percentage was that of professor (11.2 per cent).
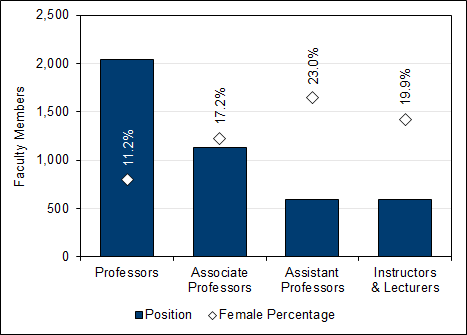
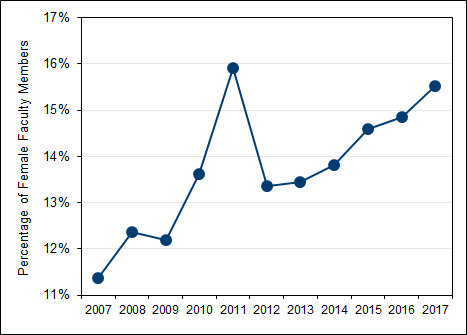
As the number of female faculty members remains a small proportion of all faculties, Engineers Canada advises readers to use caution when drawing conclusions from year-to-year variation. Small inaccuracies in the reported data as well as changes in programming will affect the percentage presented in Chart 5.3.
Appendix A
Data found in the following tables can also be downloaded in Excel format.
Undergraduate Enrolment (U)
Undergraduate Degrees Awarded (UD)
Post-graduate Student Enrolment (G)
Post-graduate Degrees Awarded (GD)
Faculty Members by institution (F)
Co-op, Internship, and Professional Experience Programs (C)
Undergraduate Enrolment (U)
| Discipline | 2013 | 2014 | 2015 | 2016 | 2017 |
|---|---|---|---|---|---|
| Biosystems | 1,080 | 1,402 | 1,558 | 1,787 | 1,855 |
| Chemical | 5,825 | 6,076 | 6,323 | 6,341 | 5,949 |
| Civil | 11,957 | 11,974 | 12,595 | 12,379 | 11,666 |
| Computer | 3,873 | 4,105 | 4,838 | 5,473 | 6,097 |
| Electrical | 10,556 | 11,411 | 11,764 | 11,391 | 11,222 |
| Engineering Physics | 3,081 | 3,222 | 2,865 | 3,303 | 3,245 |
| Environmental | 1,440 | 1,444 | 1,462 | 1,501 | 1,668 |
| Geological | 730 | 761 | 779 | 746 | 654 |
| Industrial or Manufacturing | 1,959 | 2,502 | 2,648 | 2,787 | 2,798 |
| Materials or Metallurgical | 886 | 793 | 1,004 | 951 | 869 |
| Mechanical | 15,368 | 17,091 | 18,691 | 18,415 | 18,194 |
| Mining or Mineral | 1,304 | 1,431 | 1,416 | 1,249 | 967 |
| Software | 2,974 | 3,616 | 4,114 | 4,649 | 5,020 |
| Other | 3,747 | 4,293 | 4,412 | 4,263 | 4,419 |
| Year One/Two Common Year | 7,668 | 7,083 | 7,905 | 8,067 | 7,849 |
| TOTAL | 72,449 | 77,203 | 82,375 | 83,302 | 82,473 |
| Year | Total Enrolment | Women | Percent of total |
|---|---|---|---|
| 1991 | 36,923 | 5,947 | 16.1 |
| 1992 | 40,068 | 6,659 | 16.6 |
| 1993 | 41,329 | 7,348 | 17.8 |
| 1994 | 40,709 | 7,436 | 18.3 |
| 1995 | 39,800 | 7,505 | 18.9 |
| 1996 | 40,667 | 7,659 | 18.8 |
| 1997 | 41,675 | 8,006 | 19.2 |
| 1998 | 43,487 | 8,391 | 19.3 |
| 1999 | 44,390 | 9,103 | 20.5 |
| 2000 | 46,610 | 9,460 | 20.3 |
| 2001 | 48,929 | 10,089 | 20.6 |
| 2002 | 52,024 | 10,350 | 19.9 |
| 2003 | 53,718 | 10,317 | 19.2 |
| 2004 | 54,361 | 9,901 | 18.2 |
| 2005 | 53,901 | 9,435 | 17.5 |
| 2006 | 52,484 | 9,235 | 17.6 |
| 2007 | 55,190 | 9,561 | 17.3 |
| 2008 | 56,596 | 9,695 | 17.1 |
| 2009 | 57,970 | 10,062 | 17.4 |
| 2010 | 61,505 | 10,915 | 17.7 |
| 2011 | 65,468 | 11,563 | 17.7 |
| 2012 | 69,611 | 12,626 | 18.1 |
| 2013 | 72,449 | 13,686 | 18.9 |
| 2014 | 77,203 | 14,689 | 19.0 |
| 2015 | 82,375 | 16,412 | 19.9 |
| 2016 | 83,302 | 17,393 | 20.9 |
| 2017 | 82,473 | 17,985 | 21.8 |
| Discipline | 2013 | 2014 | 2015 | 2016 | 2017 |
|---|---|---|---|---|---|
| Biosystems | 450 | 603 | 700 | 840 | 881 |
| Chemical | 1,920 | 2,067 | 2,246 | 2,323 | 2,335 |
| Civil | 2,718 | 2,755 | 3,024 | 3,103 | 3,043 |
| Computer | 416 | 478 | 586 | 750 | 904 |
| Electrical | 1,367 | 1,471 | 1,567 | 1,635 | 1,716 |
| Engineering Physics | 555 | 597 | 590 | 676 | 701 |
| Environmental | 571 | 597 | 594 | 614 | 689 |
| Geological | 268 | 280 | 288 | 275 | 244 |
| Industrial or Manufacturing | 489 | 675 | 760 | 832 | 866 |
| Materials or Metallurgical | 219 | 206 | 272 | 290 | 276 |
| Mechanical | 1,672 | 1,882 | 2,268 | 2,394 | 2,582 |
| Mining or Mineral | 191 | 226 | 215 | 187 | 155 |
| Software | 330 | 413 | 511 | 618 | 734 |
| Other | 751 | 873 | 937 | 929 | 981 |
| Year One/Two Common Year | 1,769 | 1,567 | 1,856 | 1,927 | 1,877 |
| TOTAL | 13,686 | 14,689 | 16,412 | 17,393 | 17,985 |
| Institution | Program | |
|---|---|---|
| BCIT | Mineral and Mining Exploration Engineering | 54 |
| Concordia | Aerospace Engineering | 95 |
| Laurentian | Civil Engineering | 16 |
| McGill | Bioengineering | 32 |
| McGill | BioResource Engineering | 179 |
| McMaster | Biomedical Engineering | 60 |
| UOIT | Energy Systems Engineering | 8 |
| UOIT | Mechatronics Engineering | 68 |
| UQAT | Génie électrique | 5 |
| UQO | Génie électrique | 45 |
| Waterloo | Biomedical Engineering | 147 |
| York | Civil Engineering | 152 |
| York | Mechanical Engineering | 161 |
| York | Year One - Common | 449 |
| TOTAL | 1,473 |
| Province | 2013 | 2014 | 2015 | 2016 | 2017 |
|---|---|---|---|---|---|
| AB | 7,334 | 5,818 | 7,317 | 6,839 | 7,170 |
| BC | 6,935 | 8,082 | 8,063 | 8,080 | 8,335 |
| MB | 1,412 | 1,483 | 1,521 | 1,565 | 1,580 |
| NB | 2,025 | 1,886 | 1,836 | 1,863 | 1,723 |
| NL | 937 | 989 | 1,030 | 1,046 | 1,048 |
| NS | 2,049 | 2,137 | 2,093 | 2,261 | 2,132 |
| ON | 30,314 | 34,113 | 36,344 | 37,208 | 36,434 |
| PE | 126 | 120 | 128 | 238 | |
| QC | 18,744 | 19,993 | 21,266 | 21,654 | 21,099 |
| SK | 2,574 | 2,584 | 2,778 | 2,785 | 2,714 |
| TOTAL | 72,449 | 77,203 | 82,375 | 83,302 | 82,473 |
| Province | Total Enrolment | Female Enrolment | Percent Female Enrolment |
|---|---|---|---|
| AB | 7,170 | 1,660 | 23.10% |
| BC | 8,335 | 1,788 | 21.40% |
| MB | 1,580 | 325 | 20.50% |
| NB | 1,723 | 373 | 21.70% |
| NL | 1,048 | 295 | 28.10% |
| NS | 2,132 | 469 | 22.00% |
| ON | 36,434 | 8,336 | 22.90% |
| PE | 238 | 60 | 25.20% |
| QC | 21,099 | 4,179 | 19.80% |
| SK | 2,714 | 501 | 18.50% |
| TOTAL | 82,473 | 17,985 | 21.80% |
| Province | 2013 | 2014 | 2015 | 2016 | 2017 |
|---|---|---|---|---|---|
| AB | 795 | 644 | 929 | 968 | 1,112 |
| BC | 1,018 | 1,226 | 1,407 | 1,551 | 1,675 |
| MB | 245 | 276 | 258 | 245 | 229 |
| NB | 674 | 451 | 465 | 370 | 268 |
| NL | 95 | 102 | 109 | 118 | 131 |
| NS | 479 | 513 | 536 | 674 | 692 |
| ON | 4,201 | 4,843 | 5,449 | 5,729 | 5,729 |
| PE | 20 | 30 | 30 | 61 | |
| QC | 2,643 | 2,778 | 3,118 | 3,265 | 2,973 |
| SK | 573 | 577 | 659 | 604 | 603 |
| TOTAL | 10,743 | 11,441 | 12,960 | 13,522 | 13,474 |
| Discipline | AB | BC | MB | NB | NL | NS | ON | PE | QC | SK | Total |
|---|---|---|---|---|---|---|---|---|---|---|---|
| Biosystems | 188 | 129 | 1,263 | 276 | 0 | 1,855 | |||||
| Chemical | 832 | 236 | 226 | 146 | 3,236 | 1,105 | 169 | 5,949 | |||
| Civil | 952 | 941 | 269 | 380 | 163 | 159 | 4,349 | 4,242 | 211 | 11,666 | |
| Computer | 278 | 387 | 125 | 1 | 59 | 3,793 | 1,230 | 224 | 6,097 | ||
| Electrical | 851 | 1,147 | 304 | 271 | 86 | 175 | 4,841 | 3,425 | 122 | 11,222 | |
| Engineering Physics | 73 | 957 | 227 | 1,499 | 433 | 56 | 3,245 | ||||
| Environmental | 253 | 82 | 985 | 84 | 264 | 1,668 | |||||
| Geological | 116 | 39 | 202 | 233 | 64 | 654 | |||||
| Industrial or Manufacturing | 125 | 823 | 1,465 | 385 | 2,798 | ||||||
| Materials or Metallurgical | 107 | 153 | 29 | 332 | 248 | 869 | |||||
| Mechanical | 1,648 | 1,645 | 468 | 436 | 254 | 188 | 8,150 | 5,151 | 254 | 18,194 | |
| Mining or Mineral | 102 | 150 | 74 | 291 | 351 | 967 | |||||
| Software | 151 | 218 | 134 | 1,893 | 2,478 | 146 | 5,020 | ||||
| Other | 300 | 167 | 113 | 185 | 817 | 1,920 | 238 | 378 | 301 | 4,419 | |
| Year One/Two Common Year | 1,875 | 1,778 | 285 | 123 | 302 | 111 | 2,858 | 518 | 7,849 | ||
| TOTAL | 7,170 | 8,335 | 1,580 | 1,723 | 1,048 | 2,132 | 36,434 | 238 | 21,099 | 2,714 | 82,473 |
| Discipline | AB | BC | MB | NB | NL | NS | ON | PE | QC | SK | Total |
|---|---|---|---|---|---|---|---|---|---|---|---|
| Biosystems | 82 | 54 | 609 | 137 | 0 | 881 | |||||
| Chemical | 296 | 85 | 84 | 56 | 1,231 | 528 | 56 | 2,335 | |||
| Civil | 321 | 247 | 71 | 94 | 58 | 41 | 1,164 | 997 | 50 | 3,043 | |
| Computer | 42 | 72 | 17 | 0 | 12 | 584 | 157 | 19 | 904 | ||
| Electrical | 153 | 181 | 48 | 42 | 11 | 30 | 778 | 460 | 14 | 1,716 | |
| Engineering Physics | 10 | 185 | 37 | 388 | 75 | 6 | 701 | ||||
| Environmental | 108 | 33 | 400 | 41 | 107 | 689 | |||||
| Geological | 45 | 14 | 84 | 88 | 13 | 244 | |||||
| Industrial or Manufacturing | 39 | 286 | 491 | 50 | 866 | ||||||
| Materials or Metallurgical | 33 | 50 | 5 | 106 | 83 | 276 | |||||
| Mechanical | 261 | 227 | 63 | 65 | 51 | 23 | 1,209 | 661 | 24 | 2,582 | |
| Mining or Mineral | 13 | 26 | 9 | 59 | 49 | 155 | |||||
| Software | 25 | 33 | 25 | 292 | 338 | 21 | 734 | ||||
| Other | 59 | 40 | 25 | 75 | 170 | 433 | 60 | 73 | 47 | 981 | |
| Year One/Two Common Year | 448 | 406 | 71 | 25 | 89 | 27 | 717 | 95 | 1,877 | ||
| TOTAL | 1,660 | 1,788 | 325 | 373 | 295 | 469 | 8,336 | 60 | 4,179 | 501 | 17,985 |
| Institution | 2013 | 2014 | 2015 | 2016 | 2017 |
|---|---|---|---|---|---|
| Acadia | 171 | 153 | 153 | 169 | |
| Alberta | 4,145 | 3,277 | 4,222 | 4,207 | 4,352 |
| BCIT | 486 | 784 | 882 | 379 | 405 |
| Calgary | 3,189 | 2,541 | 3,095 | 2,632 | 2,818 |
| Cape Breton | 83 | 54 | 41 | 88 | 93 |
| Carleton | 3,228 | 3,511 | 4,022 | 4,281 | 4,443 |
| Concordia | 3,090 | 3,228 | 3,463 | 3,655 | 3,459 |
| Conestoga | 98 | 161 | 176 | 195 | 104 |
| Dal | 1,343 | 1,508 | 1,588 | 1,719 | 1,794 |
| ETS | 4,382 | 5,762 | 5,201 | 5,216 | 5,344 |
| Guelph | 942 | 1,320 | 1,392 | 1,612 | 1,738 |
| Lakehead | 798 | 849 | 1,006 | 1,087 | |
| Laurentian | 382 | 544 | 481 | 498 | 427 |
| Laval | 1,987 | 1,135 | 2,443 | 2,411 | 2,329 |
| Manitoba | 1,412 | 1,483 | 1,521 | 1,565 | 1,580 |
| McGill | 2,734 | 2,847 | 2,884 | 2,924 | 2,532 |
| McMaster | 2,737 | 3,330 | 3,473 | 3,601 | 3,633 |
| Moncton | 358 | 343 | 422 | 348 | 328 |
| MUN | 937 | 989 | 1,030 | 1,046 | 1,048 |
| NSAC | 65 | 72 | 19 | 28 | 18 |
| Ottawa | 2,340 | 2,661 | 3,009 | 3,130 | 3,260 |
| Polytechnique | 4,305 | 4,704 | 4,896 | 5,048 | 4,982 |
| Queen's | 2,745 | 2,811 | 2,974 | 3,066 | 2,986 |
| Regina | 1,157 | 1,166 | 1,389 | 1,406 | 1,376 |
| RMC | 513 | 418 | 416 | 379 | 470 |
| Ryerson | 3,193 | 3,632 | 3,913 | 4,071 | 4,222 |
| Saskatchewan | 1,418 | 1,417 | 1,390 | 1,378 | 1,338 |
| SFU | 1,120 | 1,245 | 1,215 | 1,162 | 1,090 |
| Sherbrooke | 1,339 | 1,358 | 1,459 | 1,469 | 1,569 |
| SMU | 297 | 281 | 214 | 258 | 227 |
| StFX | 90 | 70 | 79 | ||
| Toronto | 4,560 | 4,672 | 4,745 | 4,681 | 4,553 |
| UBC | 3,699 | 3,501 | 3,537 | 3,821 | 3,638 |
| UBCO | 262 | 1,092 | 806 | 952 | 1,065 |
| UNB | 1,667 | 1,543 | 1,414 | 1,515 | 1,395 |
| UNBC | 84 | 85 | 89 | 102 | 190 |
| UOIT | 763 | 1,633 | 1,787 | 940 | 930 |
| UPEI | 126 | 120 | 128 | 238 | |
| UQAC | 358 | 370 | 387 | 374 | 336 |
| UQAM | 42 | 47 | |||
| UQAR | 89 | 88 | 114 | 91 | 83 |
| UQAT | 62 | 63 | 63 | 87 | 87 |
| UQO | 30 | 29 | 28 | 39 | 34 |
| UQTR | 327 | 362 | 329 | 342 | 344 |
| UVic | 1,284 | 1,374 | 1,534 | 1,664 | 1,948 |
| Waterloo | 5,182 | 5,315 | 5,456 | 5,545 | 5,750 |
| Western | 1,321 | 1,582 | 1,695 | 2,020 | 1,992 |
| Windsor | 1,245 | 1,468 | 1,540 | 1,591 | 1,563 |
| York | 267 | 207 | 260 | 513 | 365 |
| TOTAL | 72,449 | 77,203 | 82,375 | 83,302 | 82,473 |
| Institution | 2013 | 2014 | 2015 | 2016 | 2017 |
|---|---|---|---|---|---|
| Acadia | 38 | 31 | 37 | 44 | |
| Alberta | 827 | 658 | 893 | 894 | 948 |
| BCIT | 42 | 59 | 62 | 42 | 50 |
| Calgary | 773 | 645 | 791 | 677 | 712 |
| Cape Breton | 18 | 10 | 4 | 18 | 20 |
| Carleton | 450 | 504 | 669 | 712 | 762 |
| Concordia | 606 | 645 | 705 | 767 | 743 |
| Conestoga | 5 | 10 | 8 | 7 | 3 |
| Dal | 262 | 291 | 321 | 369 | 405 |
| ETS | 385 | 507 | 458 | 471 | 522 |
| Guelph | 228 | 362 | 388 | 464 | 493 |
| Lakehead | 88 | 88 | 130 | 126 | |
| Laurentian | 52 | 84 | 81 | 84 | 77 |
| Laval | 361 | 242 | 473 | 449 | 465 |
| Manitoba | 250 | 275 | 277 | 297 | 325 |
| McGill | 633 | 675 | 708 | 752 | 696 |
| McMaster | 514 | 587 | 686 | 726 | 756 |
| Moncton | 65 | 65 | 63 | 74 | 73 |
| MUN | 243 | 241 | 269 | 282 | 295 |
| NSAC | 9 | 17 | 1 | 5 | 7 |
| Ottawa | 445 | 527 | 595 | 622 | 678 |
| Polytechnique | 992 | 1,168 | 1,269 | 1,411 | 1,386 |
| Queen's | 775 | 815 | 882 | 918 | 881 |
| Regina | 266 | 249 | 251 | 234 | 239 |
| RMC | 71 | 51 | 48 | 34 | 60 |
| Ryerson | 539 | 638 | 738 | 782 | 873 |
| Saskatchewan | 279 | 277 | 272 | 283 | 263 |
| SFU | 155 | 187 | 197 | 185 | 178 |
| Sherbrooke | 213 | 207 | 214 | 221 | 234 |
| SMU | 42 | 42 | 32 | 42 | 37 |
| StFX | 26 | 22 | 27 | ||
| Toronto | 1,116 | 1,198 | 1,282 | 1,370 | 1,458 |
| UBC | 783 | 787 | 863 | 974 | 952 |
| UBCO | 32 | 148 | 124 | 149 | 173 |
| UNB | 255 | 277 | 244 | 314 | 300 |
| UNBC | 38 | 32 | 35 | 43 | 84 |
| UOIT | 66 | 111 | 144 | 85 | 91 |
| UPEI | 18 | 10 | 14 | 60 | |
| UQAC | 53 | 58 | 64 | 71 | 59 |
| UQAM | 3 | 4 | |||
| UQAR | 13 | 8 | 6 | 5 | 3 |
| UQAT | 13 | 12 | 9 | 11 | 12 |
| UQO | 3 | 5 | 7 | 11 | 6 |
| UQTR | 50 | 69 | 62 | 60 | 52 |
| UVic | 133 | 151 | 188 | 242 | 351 |
| Waterloo | 975 | 1,058 | 1,188 | 1,301 | 1,460 |
| Western | 261 | 312 | 343 | 422 | 421 |
| Windsor | 178 | 236 | 242 | 253 | 258 |
| York | 47 | 38 | 51 | 91 | 67 |
| TOTAL | 13,686 | 14,689 | 16,412 | 17,393 | 17,985 |
| Institution |
Biosystems
|
Chemical
|
Civil
|
Computer
|
Electrical
|
Engineering Physics
|
Environmental
|
Geological
|
Industrial or Manufacturing
|
Materials or Metallurgical
|
Mechanical
|
Mining or Mineral
|
Software
|
Other
|
Year One/Two Common Year
|
|---|---|---|---|---|---|---|---|---|---|---|---|---|---|---|---|
| Alberta | 467 | 672 | 278 | 491 | 73 | 107 | 997 | 102 | 157 | 1,008 | |||||
| BCIT | 137 | 127 | 141 | ||||||||||||
| Calgary | 365 | 280 | 360 | 651 | 151 | 143 | 867 | ||||||||
| Cape Breton | 93 | ||||||||||||||
| Carleton | 185 | 869 | 402 | 1,014 | 110 | 371 | 542 | 400 | 550 | ||||||
| Concordia | 854 | 246 | 383 | 332 | 974 | 670 | |||||||||
| Conestoga | 43 | 62 | |||||||||||||
| Dal | 146 | 159 | 175 | 82 | 125 | 29 | 188 | 74 | 817 | ||||||
| ETS | 1,510 | 1,357 | 414 | 1,326 | 736 | ||||||||||
| Guelph | 424 | 262 | 365 | 619 | 68 | ||||||||||
| Laurentian | 125 | 171 | 121 | 10 | |||||||||||
| Laval | 123 | 113 | 383 | 117 | 162 | 153 | 84 | 105 | 157 | 41 | 466 | 113 | 200 | 112 | |
| Manitoba | 129 | 269 | 125 | 304 | 468 | 285 | |||||||||
| McGill | 316 | 346 | 159 | 482 | 207 | 642 | 82 | 273 | 24 | ||||||
| McMaster | 363 | 382 | 186 | 467 | 124 | 144 | 662 | 333 | 972 | ||||||
| Moncton | 148 | 72 | 108 | ||||||||||||
| MUN | 163 | 59 | 86 | 254 | 185 | 302 | |||||||||
| NSAC | 18 | ||||||||||||||
| Ottawa | 293 | 396 | 603 | 395 | 573 | 739 | 261 | ||||||||
| Polytechnique | 153 | 421 | 750 | 368 | 488 | 280 | 95 | 472 | 991 | 156 | 599 | 210 | |||
| Queen's | 315 | 308 | 274 | 205 | 442 | 105 | 520 | 87 | 730 | ||||||
| Regina | 164 | 223 | 385 | 146 | 301 | 156 | |||||||||
| RMC | 27 | 63 | 52 | 33 | 64 | 70 | 161 | ||||||||
| Ryerson | 360 | 401 | 722 | 447 | 679 | 256 | 823 | 461 | 73 | ||||||
| Saskatchewan | 169 | 211 | 59 | 122 | 56 | 41 | 64 | 254 | 363 | ||||||
| SFU | 718 | 372 | |||||||||||||
| Sherbrooke | 252 | 281 | 280 | 318 | 438 | ||||||||||
| SMU | 227 | ||||||||||||||
| Toronto | 481 | 426 | 648 | 592 | 823 | 412 | 188 | 710 | 83 | 191 | |||||
| UBC | 94 | 236 | 414 | 332 | 496 | 239 | 63 | 116 | 153 | 386 | 150 | 167 | 792 | ||
| UBCO | 178 | 128 | 265 | 494 | |||||||||||
| UNB | 226 | 232 | 1 | 199 | 39 | 328 | 134 | 113 | 123 | ||||||
| UNBC | 190 | ||||||||||||||
| UOIT | 193 | 31 | 450 | 131 | 126 | ||||||||||
| UPEI | 238 | ||||||||||||||
| UQAC | 118 | 26 | 76 | 33 | 83 | ||||||||||
| UQAR | 17 | 35 | 32 | ||||||||||||
| UQAT | 44 | 43 | |||||||||||||
| UQO | 34 | ||||||||||||||
| UQTR | 2 | 99 | 90 | 153 | |||||||||||
| UVic | 94 | 212 | 55 | 396 | 481 | 218 | 492 | ||||||||
| Waterloo | 922 | 509 | 904 | 449 | 214 | 97 | 1,536 | 500 | 619 | ||||||
| Western | 206 | 229 | 87 | 181 | 440 | 205 | 57 | 587 | |||||||
| Windsor | 237 | 351 | 36 | 125 | 748 | 66 | |||||||||
| York | 95 | 105 | 65 | 63 | 37 | ||||||||||
| TOTAL | 1,855 | 5,949 | 11,666 | 6,097 | 11,222 | 3,245 | 1,668 | 654 | 2,798 | 869 | 18,194 | 967 | 5,020 | 4,419 | 7,849 |
| Institution |
Biosystems
|
Chemical
|
Civil
|
Computer
|
Electrical
|
Engineering Physics
|
Environmental
|
Geological
|
Industrial or Manufacturing
|
Materials or Metallurgical
|
Mechanical
|
Mining or Mineral
|
Software
|
Other
|
Year One/Two Common Year
|
|---|---|---|---|---|---|---|---|---|---|---|---|---|---|---|---|
| Acadia | 44 | ||||||||||||||
| Alberta | 168 | 212 | 31 | 75 | 10 | 35 | 131 | 17 | 182 | 33 | |||||
| BCIT | 24 | 10 | 8 | ||||||||||||
| Calgary | 111 | 108 | 70 | 106 | 18 | 213 | 51 | ||||||||
| Cape Breton | 18 | ||||||||||||||
| Carleton | 64 | 205 | 32 | 139 | 18 | 94 | 49 | 42 | 69 | ||||||
| Concordia | 259 | 23 | 70 | 143 | 159 | 113 | |||||||||
| Conestoga | 3 | 5 | |||||||||||||
| Dal | 42 | 39 | 20 | 28 | 32 | 6 | 23 | 9 | 172 | ||||||
| ETS | 221 | 124 | 28 | 66 | 32 | ||||||||||
| Guelph | 217 | 31 | 147 | 59 | 10 | ||||||||||
| Lakehead | 35 | 60 | 13 | 14 | 5 | ||||||||||
| Laurentian | 38 | 21 | 23 | 3 | |||||||||||
| Laval | 56 | 37 | 81 | 7 | 17 | 20 | 38 | 32 | 49 | 11 | 46 | 17 | 19 | 19 | |
| Manitoba | 54 | 61 | 17 | 44 | 57 | 65 | |||||||||
| McGill | 165 | 140 | 25 | 118 | 80 | 140 | 20 | 47 | 17 | ||||||
| McMaster | 128 | 88 | 21 | 94 | 14 | 43 | 77 | 44 | 218 | ||||||
| Moncton | 43 | 17 | 14 | ||||||||||||
| MUN | 51 | 9 | 10 | 43 | 97 | 72 | |||||||||
| NSAC | 5 | ||||||||||||||
| Ottawa | 143 | 140 | 123 | 46 | 61 | 67 | 43 | ||||||||
| Polytechnique | 83 | 229 | 312 | 49 | 77 | 52 | 54 | 223 | 193 | 28 | 71 | 41 | |||
| Queen's | 151 | 131 | 34 | 42 | 113 | 66 | 134 | 26 | 222 | ||||||
| Regina | 13 | 83 | 52 | 16 | 5 | 65 | |||||||||
| RMC | 10 | 2 | 3 | 1 | 6 | 12 | |||||||||
| Ryerson | 159 | 119 | 146 | 45 | 78 | 75 | 65 | 29 | 66 | ||||||
| Saskatchewan | 68 | 53 | 4 | 9 | 5 | 21 | 16 | 23 | 84 | ||||||
| SFU | 142 | 42 | |||||||||||||
| Sherbrooke | 88 | 62 | 11 | 16 | 44 | ||||||||||
| SMU | 42 | ||||||||||||||
| Toronto | 226 | 157 | 114 | 146 | 220 | 163 | 71 | 162 | 23 | 89 | |||||
| UBC | 37 | 85 | 116 | 70 | 107 | 40 | 29 | 48 | 44 | 96 | 25 | 241 | 36 | ||
| UBCO | 25 | 12 | 21 | 149 | |||||||||||
| UNB | 97 | 57 | 18 | 18 | 18 | 41 | 11 | 32 | 21 | ||||||
| UNBC | 43 | ||||||||||||||
| UOIT | 39 | 5 | 67 | 24 | 36 | ||||||||||
| UQAC | 36 | 3 | 6 | 15 | 11 | ||||||||||
| UQAR | 2 | 2 | 2 | ||||||||||||
| UQAT | 6 | 5 | |||||||||||||
| UQO | 11 | ||||||||||||||
| UQTR | 10 | 39 | 11 | ||||||||||||
| UVic | 2 | 47 | 51 | 21 | 93 | ||||||||||
| Waterloo | 298 | 168 | 100 | 87 | 111 | 27 | 211 | 82 | 219 | ||||||
| Western | 90 | 65 | 6 | 29 | 57 | 33 | 124 | 20 | |||||||
| Windsor | 60 | 43 | 20 | 26 | 88 | 16 | |||||||||
| York | 23 | 17 | 15 | 10 | |||||||||||
| TOTAL | 812 | 2,323 | 3,103 | 750 | 1,671 | 676 | 614 | 275 | 834 | 290 | 2,428 | 187 | 621 | 1,950 | 947 |
Undergraduate Degrees Awarded (UD)
| Discipline | 2013 | 2014 | 2015 | 2016 | 2017 |
|---|---|---|---|---|---|
| Biosystems | 194 | 211 | 235 | 278 | 384 |
| Chemical | 1,307 | 1,292 | 1,297 | 1,370 | 1,511 |
| Civil | 2,751 | 2,688 | 2,772 | 2,757 | 2,843 |
| Computer | 686 | 573 | 713 | 713 | 766 |
| Electrical | 2,137 | 2,202 | 2,375 | 2,435 | 2,578 |
| Engineering Physics | 548 | 532 | 599 | 588 | 618 |
| Environmental | 300 | 360 | 337 | 363 | 302 |
| Geological | 164 | 152 | 192 | 187 | 207 |
| Industrial or Manufacturing | 361 | 440 | 527 | 472 | 518 |
| Materials or Metallurgical | 216 | 213 | 235 | 248 | 226 |
| Mechanical | 3,255 | 3,338 | 3,634 | 3,791 | 3,987 |
| Mining or Mineral | 220 | 280 | 307 | 345 | 342 |
| Software | 434 | 547 | 632 | 634 | 751 |
| Other | 790 | 908 | 702 | 724 | 749 |
| Year One/Two Common Year | 72 | 0 | 0 | ||
| TOTAL | 13,363 | 13,808 | 14,557 | 14,904.60 | 15,781.50 |
| Discipline | 2013 | 2014 | 2015 | 2016 | 2017 |
|---|---|---|---|---|---|
| Biosystems | 87 | 101 | 97 | 115 | 180 |
| Chemical | 427 | 402 | 442 | 466 | 559 |
| Civil | 605 | 597 | 644 | 657 | 713 |
| Computer | 71 | 59 | 67 | 61 | 85 |
| Electrical | 283 | 330 | 335 | 314 | 361 |
| Engineering Physics | 92 | 93 | 115 | 120 | 112 |
| Environmental | 121 | 147 | 138 | 144 | 146 |
| Geological | 58 | 57 | 71 | 69 | 79 |
| Industrial or Manufacturing | 73 | 125 | 139 | 138 | 156 |
| Materials or Metallurgical | 43 | 53 | 51 | 66 | 58 |
| Mechanical | 344 | 357 | 391 | 428 | 485 |
| Mining or Mineral | 38 | 44 | 64 | 62 | 45 |
| Software | 43 | 57 | 57 | 64 | 106 |
| Other | 162 | 182 | 129 | 178 | 159 |
| Year One/Two Common Year | 17 | 0 | 0 | ||
| TOTAL | 2,447 | 2,621 | 2,740 | 2,882 | 3,244 |
| Province | 2013 | 2014 | 2015 | 2016 | 2017 |
|---|---|---|---|---|---|
| AB | 1,282 | 1,346 | 1,373 | 1,408 | 1,467 |
| BC | 1,278 | 1,324 | 1,519 | 1,470 | 1,622 |
| MB | 188 | 219 | 218 | 255 | 312 |
| NB | 320 | 308 | 307 | 340 | 345 |
| NL | 270 | 194 | 196 | 197 | 210 |
| NS | 477 | 654 | 318 | 346 | 367 |
| ON | 5,927 | 5,996 | 6,465 | 6,692.60 | 7,126.50 |
| PE | 7 | ||||
| QC | 3,202 | 3,370 | 3,676 | 3,771 | 3,855 |
| SK | 419 | 397 | 485 | 425 | 470 |
| TOTAL | 13,363 | 13,808 | 14,557 | 14,904.60 | 15,781.50 |
| Province | 2013 | 2014 | 2015 | 2016 | 2017 |
|---|---|---|---|---|---|
| AB | 290 | 277 | 319 | 299 | 321 |
| BC | 172 | 210 | 265 | 253 | 286 |
| MB | 29 | 52 | 42 | 47 | 60 |
| NB | 45 | 65 | 53 | 55 | 64 |
| NL | 77 | 44 | 42 | 34 | 58 |
| NS | 101 | 142 | 63 | 57 | 82 |
| ON | 1,123 | 1,155 | 1,215 | 1,354 | 1,522 |
| PE | 0 | ||||
| QC | 518 | 593 | 656 | 698 | 750 |
| SK | 92 | 83 | 85 | 85 | 101 |
| TOTAL | 2,447 | 2,621 | 2,740 | 2,882 | 3,244 |
| Province | 2013 | 2014 | 2015 | 2016 | 2017 |
|---|---|---|---|---|---|
| AB | 107 | 122 | 114 | 171 | 169 |
| BC | 109 | 140 | 197 | 193 | 239 |
| MB | 14 | 34 | 44 | 41 | 63 |
| NB | 57 | 70 | 71 | 69 | 63 |
| NL | 16 | 30 | 22 | 21 | 21 |
| NS | 65 | 103 | 53 | 63 | 64 |
| ON | 585 | 640 | 816 | 833 | 1,020.50 |
| PE | 0 | ||||
| QC | 353 | 424 | 421 | 441 | 514 |
| SK | 63 | 63 | 84 | 72 | 74 |
| TOTAL | 1,369 | 1,626 | 1,822 | 1,904 | 2,227.50 |
| Discipline | AB | BC | MB | NB | NL | NS | ON | PE | QC | SK |
|---|---|---|---|---|---|---|---|---|---|---|
| Biosystems | 39 | 37 | 212 | 96 | ||||||
| Chemical | 245 | 65 | 56 | 50 | 799 | 221 | 75 | |||
| Civil | 252 | 278 | 68 | 108 | 47 | 62 | 1,006 | 950 | 72 | |
| Computer | 34 | 106 | 21 | 1 | 15 | 409 | 151 | 29 | ||
| Electrical | 271 | 283 | 82 | 62 | 18 | 66 | 1,160 | 608 | 28 | |
| Engineering Physics | 13 | 193 | 333.50 | 68 | 10 | |||||
| Environmental | 60 | 22 | 147 | 22 | 51 | |||||
| Geological | 46 | 15 | 70 | 49 | 27 | |||||
| Industrial or Manufacturing | 41 | 208 | 251 | 18 | ||||||
| Materials or Metallurgical | 40 | 32 | 13 | 88 | 53 | |||||
| Mechanical | 387 | 432 | 104 | 73 | 69 | 71 | 1799 | 971 | 81 | |
| Mining or Mineral | 69 | 27 | 42 | 119 | 85 | |||||
| Software | 35 | 32 | 6 | 378 | 283 | 17 | ||||
| Other | 121 | 29 | 24 | 61 | 398 | 7 | 47 | 62 | ||
| TOTAL | 1,467 | 1,622 | 312 | 345 | 210 | 367 | 7,126.50 | 7 | 3,855 | 470 |
| Discipline | AB | BC | MB | NB | NL | NS | ON | PE | QC | SK |
|---|---|---|---|---|---|---|---|---|---|---|
| Biosystems | 12 | 14 | 101 | 53 | ||||||
| Chemical | 76 | 26 | 20 | 18 | 295 | 104 | 20 | |||
| Civil | 80 | 54 | 11 | 24 | 11 | 15 | 281 | 216 | 21 | |
| Computer | 6 | 18 | 5 | 1 | 43 | 9 | 3 | |||
| Electrical | 50 | 33 | 14 | 4 | 7 | 7 | 172 | 71 | 3 | |
| Engineering Physics | 30 | 72 | 10 | |||||||
| Environmental | 31 | 11 | 74 | 9 | 21 | |||||
| Geological | 21 | 7 | 26 | 20 | 5 | |||||
| Industrial or Manufacturing | 10 | 63 | 80 | 3 | ||||||
| Materials or Metallurgical | 11 | 4 | 4 | 26 | 13 | |||||
| Mechanical | 55 | 46 | 16 | 8 | 13 | 12 | 223 | 104 | 8 | |
| Mining or Mineral | 3 | 3 | 5 | 19 | 15 | |||||
| Software | 8 | 3 | 50 | 38 | 7 | |||||
| Other | 32 | 5 | 1 | 26 | 77 | 8 | 10 | |||
| TOTAL | 321 | 286 | 60 | 64 | 58 | 82 | 1,522 | 750 | 101 |
| Institution | 2013 | 2014 | 2015 | 2016 | 2017 |
|---|---|---|---|---|---|
| Acadia | 0 | ||||
| Alberta | 760 | 737 | 792 | 810 | 827 |
| BCIT | 52 | 54 | 71 | 73 | 72 |
| Calgary | 522 | 609 | 581 | 598 | 640 |
| Carleton | 427 | 453 | 530 | 568 | 584 |
| Concordia | 462 | 458 | 491 | 472 | 500 |
| Conestoga | 11 | 30 | 26 | 30 | 42 |
| Dal | 477 | 582 | 318 | 346 | 367 |
| ETS | 828 | 788 | 898 | 948 | 1,018 |
| Guelph | 104 | 220 | 212 | 279 | 318 |
| Lakehead | 302 | 283 | 298 | 312 | |
| Laurentian | 249 | 83 | 78 | 110 | 106 |
| Laval | 300 | 300 | 441 | 502 | 499 |
| Manitoba | 188 | 219 | 218 | 255 | 312 |
| McGill | 487 | 546 | 574 | 565 | 586 |
| McMaster | 590 | 588 | 653 | 644 | 717 |
| Moncton | 67 | 71 | 49 | 45 | 65 |
| MUN | 270 | 194 | 196 | 197 | 210 |
| NSAC | 72 | 0 | 0 | ||
| Ottawa | 286 | 363 | 374 | 347 | 444 |
| Polytechnique | 686 | 790 | 780 | 797 | 777 |
| Queen's | 641 | 594 | 595 | 576 | 625 |
| Regina | 123 | 158 | 160 | 153 | 149 |
| RMC | 93 | 0 | 89 | 0 | 0 |
| Ryerson | 514 | 557 | 567 | 733 | 837 |
| Saskatchewan | 296 | 239 | 325 | 272 | 321 |
| SFU | 142 | 157 | 189 | 220 | 244 |
| Sherbrooke | 279 | 276 | 286 | 299 | 304 |
| SMU | 0 | 0 | 0 | ||
| Toronto | 960 | 938 | 1,035 | 1,048 | 1,116 |
| UBC | 764 | 758 | 889 | 769 | 784 |
| UBCO | 142 | 145 | 151 | 157 | 221 |
| UNB | 253 | 237 | 258 | 295 | 280 |
| UNBC | 14 | 25 | 28 | 32 | 30 |
| UOIT | 228 | 239 | 262 | 289 | 355 |
| UPEI | 7 | ||||
| UQAC | 65 | 71 | 72 | 71 | 84 |
| UQAM | 9 | 6 | |||
| UQAR | 16 | 16 | 16 | 14 | 13 |
| UQAT | 7 | 10 | 14 | 10 | 14 |
| UQO | 7 | 5 | 5 | 5 | |
| UQTR | 56 | 104 | 99 | 88 | 60 |
| UVic | 164 | 185 | 191 | 219 | 271 |
| Waterloo | 1,082 | 1,113 | 1,194 | 1,136 | 1,206 |
| Western | 249 | 291 | 305 | 317 | 367 |
| Windsor | 191 | 221 | 218 | 283 | 360 |
| York | 23 | 29 | 21 | 50 | |
| TOTAL | 13,363 | 13,808 | 14,557 | 14,904.60 | 15,781.50 |
| Institution | 2013 | 2014 | 2015 | 2016 | 2017 |
|---|---|---|---|---|---|
| Acadia | 0 | ||||
| Alberta | 159 | 141 | 176 | 162 | 163 |
| BCIT | 1 | 1 | 2 | 5 | 5 |
| Calgary | 131 | 136 | 143 | 137 | 158 |
| Carleton | 74 | 74 | 94 | 102 | 92 |
| Concordia | 88 | 96 | 92 | 100 | 105 |
| Conestoga | 1 | 5 | 1 | 1 | 1 |
| Dal | 101 | 125 | 63 | 57 | 82 |
| ETS | 90 | 65 | 83 | 79 | 89 |
| Guelph | 30 | 58 | 49 | 70 | 99 |
| Lakehead | 28 | 30 | 31 | 32 | |
| Laurentian | 33 | 16 | 8 | 22 | 11 |
| Laval | 49 | 49 | 90 | 94 | 94 |
| Manitoba | 29 | 52 | 42 | 47 | 60 |
| McGill | 75 | 134 | 127 | 129 | 161 |
| McMaster | 104 | 111 | 101 | 111 | 143 |
| Moncton | 8 | 20 | 10 | 3 | 10 |
| MUN | 77 | 44 | 42 | 34 | 58 |
| NSAC | 17 | 0 | 0 | ||
| Ottawa | 57 | 70 | 82 | 72 | 104 |
| Polytechnique | 148 | 168 | 175 | 201 | 224 |
| Queen's | 170 | 159 | 170 | 184 | 195 |
| Regina | 23 | 36 | 22 | 25 | 37 |
| RMC | 11 | 0 | 9 | 0 | 0 |
| Ryerson | 92 | 112 | 112 | 127 | 152 |
| Saskatchewan | 69 | 47 | 63 | 60 | 64 |
| SFU | 12 | 21 | 37 | 37 | 26 |
| Sherbrooke | 46 | 40 | 46 | 44 | 49 |
| SMU | 0 | 0 | 0 | ||
| Toronto | 207 | 237 | 236 | 275 | 280 |
| UBC | 128 | 141 | 185 | 156 | 187 |
| UBCO | 11 | 20 | 21 | 15 | 28 |
| UNB | 37 | 45 | 43 | 52 | 54 |
| UNBC | 8 | 10 | 10 | 17 | 15 |
| UOIT | 21 | 17 | 16 | 17 | 24 |
| UPEI | 0 | ||||
| UQAC | 8 | 10 | 5 | 14 | 20 |
| UQAM | 0 | 0 | |||
| UQAR | 0 | 3 | 2 | 4 | 0 |
| UQAT | 2 | 1 | 3 | 5 | 3 |
| UQO | 2 | 0 | 0 | 0 | |
| UQTR | 10 | 27 | 33 | 28 | 5 |
| UVic | 12 | 17 | 10 | 23 | 25 |
| Waterloo | 218 | 189 | 201 | 211 | 255 |
| Western | 48 | 48 | 64 | 73 | 93 |
| Windsor | 29 | 26 | 38 | 52 | 63 |
| York | 3 | 3 | 5 | 10 | |
| TOTAL | 2,447 | 2,621 | 2,740 | 2,882 | 3,244 |
| Institution |
Biosystems
|
Chemical
|
Civil
|
Computer
|
Electrical
|
Engineering Physics
|
Environmental
|
Geological
|
Industrial or Manufacturing
|
Materials or Metallurgical
|
Mechanical
|
Mining or Mineral
|
Software
|
Other
|
|---|---|---|---|---|---|---|---|---|---|---|---|---|---|---|
| Alberta | 160 | 156 | 34 | 113 | 13 | 40 | 194 | 69 | 48 | |||||
| BCIT | 24 | 20 | 28 | |||||||||||
| Calgary | 85 | 96 | 158 | 193 | 35 | 73 | ||||||||
| Carleton | 21 | 129 | 24 | 133 | 9 | 41 | 98 | 40 | 89 | |||||
| Concordia | 170 | 17 | 54 | 44 | 165 | 50 | ||||||||
| Conestoga | 11 | 31 | ||||||||||||
| Dal | 50 | 62 | 66 | 22 | 41 | 13 | 71 | 42 | ||||||
| ETS | 331 | 251 | 68 | 263 | 105 | |||||||||
| Guelph | 89 | 36 | 68 | 125 | ||||||||||
| Laurentian | 23 | 35 | 48 | |||||||||||
| Laval | 26 | 21 | 127 | 20 | 32 | 28 | 22 | 18 | 33 | 14 | 92 | 36 | 23 | 7 |
| Manitoba | 37 | 68 | 21 | 82 | 104 | |||||||||
| McGill | 43 | 90 | 67 | 18 | 114 | 39 | 149 | 19 | 47 | |||||
| McMaster | 96 | 97 | 39 | 138 | 35 | 49 | 168 | 95 | ||||||
| Moncton | 30 | 18 | 17 | |||||||||||
| MUN | 47 | 15 | 18 | 69 | 61 | |||||||||
| Ottawa | 33 | 84 | 125 | 21 | 54 | 88 | 39 | |||||||
| Polytechnique | 27 | 58 | 158 | 41 | 62 | 40 | 17 | 89 | 162 | 30 | 58 | 35 | ||
| Queen's | 105 | 84 | 37 | 46 | 112 | 47 | 146 | 48 | ||||||
| Regina | 17 | 35 | 18 | 17 | 62 | |||||||||
| RMC | ||||||||||||||
| Ryerson | 69 | 53 | 184 | 67 | 142 | 68 | 152 | 102 | ||||||
| Saskatchewan | 75 | 72 | 12 | 28 | 10 | 16 | 27 | 81 | ||||||
| SFU | 143 | 101 | ||||||||||||
| Sherbrooke | 50 | 68 | 48 | 46 | 92 | |||||||||
| SMU | ||||||||||||||
| Toronto | 138 | 111 | 339 | 178 | 97 | 39 | 191 | 23 | ||||||
| UBC | 23 | 65 | 141 | 93 | 132 | 50 | 30 | 46 | 32 | 116 | 27 | 29 | ||
| UBCO | 72 | 53 | 96 | |||||||||||
| UNB | 56 | 78 | 1 | 44 | 15 | 56 | 6 | 24 | ||||||
| UNBC | 30 | |||||||||||||
| UOIT | 83 | 6 | 182 | 30 | 54 | |||||||||
| UPEI | 7 | |||||||||||||
| UQAC | 29 | 7 | 13 | 14 | 21 | |||||||||
| UQAR | 3 | 5 | 5 | |||||||||||
| UQAT | 7 | 7 | ||||||||||||
| UQTR | 2 | 26 | 17 | 15 | ||||||||||
| UVic | 16 | 41 | 13 | 78 | 91 | 32 | ||||||||
| Waterloo | 235 | 118 | 153 | 119 | 33 | 23 | 285 | 106 | 134 | |||||
| Western | 65 | 80 | 3 | 38 | 110 | 63 | 8 | |||||||
| Windsor | 78 | 64 | 5 | 37 | 176 | |||||||||
| York | 18 | 4 | 12 | 5 | 11 | |||||||||
| TOTAL | 384 | 1,511 | 2,843 | 766 | 2,578 | 618 | 302 | 207 | 518 | 226 | 3,987 | 342 | 751 | 749 |
| Institution |
Biosystems
|
Chemical
|
Civil
|
Computer
|
Electrical
|
Engineering Physics
|
Environmental
|
Geological
|
Industrial or Manufacturing
|
Materials or Metallurgical
|
Mechanical
|
Mining or Mineral
|
Software
|
Other
|
|---|---|---|---|---|---|---|---|---|---|---|---|---|---|---|
| Alberta | 44 | 48 | 6 | 17 | 11 | 21 | 3 | 13 | ||||||
| BCIT | 3 | 1 | 1 | |||||||||||
| Calgary | 32 | 32 | 33 | 34 | 8 | 19 | ||||||||
| Carleton | 11 | 25 | 2 | 15 | 1 | 16 | 10 | 2 | 10 | |||||
| Concordia | 45 | 1 | 9 | 23 | 17 | 10 | ||||||||
| Conestoga | 1 | |||||||||||||
| Dal | 18 | 15 | 7 | 11 | 10 | 4 | 12 | 5 | ||||||
| ETS | 46 | 24 | 5 | 9 | 5 | |||||||||
| Guelph | 44 | 4 | 31 | 20 | ||||||||||
| Laurentian | 7 | 1 | 3 | |||||||||||
| Laval | 11 | 6 | 28 | 1 | 3 | 2 | 9 | 4 | 12 | 4 | 6 | 4 | 2 | 2 |
| Manitoba | 14 | 11 | 5 | 14 | 16 | |||||||||
| McGill | 26 | 44 | 22 | 1 | 19 | 9 | 25 | 4 | 11 | |||||
| McMaster | 39 | 26 | 5 | 28 | 2 | 13 | 19 | 11 | ||||||
| Moncton | 7 | 1 | 2 | |||||||||||
| MUN | 11 | 1 | 7 | 13 | 26 | |||||||||
| Ottawa | 18 | 28 | 28 | 4 | 10 | 11 | 5 | |||||||
| Polytechnique | 16 | 33 | 49 | 5 | 8 | 8 | 9 | 38 | 35 | 7 | 10 | 6 | ||
| Queen's | 51 | 39 | 6 | 5 | 27 | 19 | 39 | 9 | ||||||
| Regina | 2 | 15 | 3 | 7 | 10 | |||||||||
| RMC | ||||||||||||||
| Ryerson | 28 | 20 | 38 | 8 | 13 | 22 | 11 | 12 | ||||||
| Saskatchewan | 20 | 21 | 1 | 3 | 6 | 5 | 8 | |||||||
| SFU | 21 | 5 | ||||||||||||
| Sherbrooke | 21 | 17 | 1 | 3 | 7 | |||||||||
| SMU | ||||||||||||||
| Toronto | 48 | 34 | 60 | 42 | 37 | 13 | 39 | 7 | ||||||
| UBC | 7 | 26 | 32 | 18 | 22 | 9 | 16 | 21 | 4 | 24 | 3 | 5 | ||
| UBCO | 11 | 7 | 10 | |||||||||||
| UNB | 20 | 17 | 3 | 7 | 6 | 1 | ||||||||
| UNBC | 15 | |||||||||||||
| UOIT | 7 | 7 | 2 | 8 | ||||||||||
| UPEI | ||||||||||||||
| UQAC | 9 | 1 | 7 | 3 | ||||||||||
| UQAR | ||||||||||||||
| UQAT | 1 | 2 | ||||||||||||
| UQTR | 3 | 2 | ||||||||||||
| UVic | 5 | 8 | 3 | 6 | 3 | |||||||||
| Waterloo | 70 | 41 | 8 | 18 | 23 | 7 | 29 | 17 | 42 | |||||
| Western | 32 | 26 | 10 | 9 | 13 | 3 | ||||||||
| Windsor | 24 | 6 | 4 | 4 | 25 | |||||||||
| York | 6 | 2 | 2 | |||||||||||
| TOTAL | 180 | 559 | 713 | 85 | 361 | 112 | 146 | 79 | 156 | 58 | 485 | 45 | 106 | 159 |
Post-graduate Enrolment (G)
| Year | 2013 | 2014 | 2015 | 2016 | 2017 |
|---|---|---|---|---|---|
| Cdn Male | 4,654 | 4,001 | 4,259 | 4,232 | 4,308 |
| Cdn Female | 1,396 | 1,221 | 1,334 | 1,459 | 1,568 |
| Visa Male | 4,454 | 4,945 | 5,569 | 5,814 | 6,568 |
| Visa Female | 1,348 | 1,679 | 1,877 | 1,971 | 2,278 |
| Total | 11,852 | 11,845 | 13,040 | 13,476 | 14,723 |
| Year | 2013 | 2014 | 2015 | 2016 | 2017 |
|---|---|---|---|---|---|
| Cdn Male | 3,336 | 3,065 | 3,064 | 2,839 | 2,675 |
| Cdn Female | 1,089 | 1,000 | 989 | 963 | 965 |
| Visa Male | 3,287 | 3,615 | 4,018 | 4,136 | 4,266 |
| Visa Female | 997 | 1,076 | 1,150 | 1,209 | 1,354 |
| Total | 8,709 | 8,756 | 9,221 | 9,146 | 9,261 |
| Year | 2013 | 2014 | 2015 | 2016 | 2017 |
|---|---|---|---|---|---|
| Cdn Male | 1,790 | 1,290 | 1,190 | 1,470 | 1,314 |
| Cdn Female | 498 | 395 | 324 | 375 | 360 |
| Visa Male | 204 | 203 | 228 | 310 | 309 |
| Visa Female | 47 | 64 | 70 | 110 | 120 |
| Total | 2,539 | 1,952 | 1,812 | 2,264 | 2,103 |
| Year | 2013 | 2014 | 2015 | 2016 | 2017 |
|---|---|---|---|---|---|
| Cdn Male | 285 | 239 | 255 | 236 | 232 |
| Cdn Female | 59 | 52 | 56 | 53 | 50 |
| Visa Male | 39 | 34 | 34 | 31 | 36 |
| Visa Female | 2 | 9 | 6 | 7 | 9 |
| Total | 386 | 334 | 351 | 327 | 327 |
| Discipline | 2013 | 2014 | 2015 | 2016 | 2017 |
|---|---|---|---|---|---|
| Biosystems | 378 | 415 | 431 | 464 | 663 |
| Chemical | 1,026 | 910 | 989 | 1,070 | 1,108 |
| Civil | 1,875 | 1,843 | 2,064 | 2,280 | 2,464 |
| Computer | 439 | 337 | 402 | 376 | 417 |
| Electrical | 3,420 | 3,412 | 3,645 | 3,582 | 3,683 |
| Engineering Physics | 184 | 202 | 203 | 179 | 192 |
| Environmental | 296 | 352 | 360 | 396 | 364 |
| Geological | 18 | 16 | 16 | 17 | 13 |
| Industrial or Manufacturing | 427 | 449 | 415 | 458 | 573 |
| Materials or Metallurgical | 261 | 242 | 239 | 251 | 253 |
| Mechanical | 2,110 | 2,148 | 2,517 | 2,699 | 3,068 |
| Mining or Mineral | 148 | 188 | 211 | 210 | 179 |
| Software | 284 | 297 | 344 | 347 | 412 |
| Other | 1,856 | 1,836 | 1,878 | 1,900 | 2,139 |
| TOTAL | 12,725 | 12,646 | 13,715 | 14,229 | 15,529 |
| Discipline | 2013 | 2014 | 2015 | 2016 | 2017 |
|---|---|---|---|---|---|
| Biosystems | 429 | 448 | 483 | 508 | 648 |
| Chemical | 1,007 | 958 | 967 | 980 | 967 |
| Civil | 1,292 | 1,334 | 1,424 | 1,352 | 1,408 |
| Computer | 145 | 149 | 199 | 230 | 227 |
| Electrical | 2,354 | 2,406 | 2,423 | 2,390 | 2,246 |
| Engineering Physics | 219 | 227 | 247 | 192 | 213 |
| Environmental | 136 | 116 | 126 | 143 | 127 |
| Geological | 11 | 6 | 2 | 0 | 3 |
| Industrial or Manufacturing | 185 | 185 | 214 | 193 | 175 |
| Materials or Metallurgical | 359 | 366 | 362 | 380 | 385 |
| Mechanical | 1,631 | 1,608 | 1,662 | 1,666 | 1,665 |
| Mining or Mineral | 100 | 119 | 124 | 142 | 118 |
| Software | 27 | 51 | 17 | 29 | 44 |
| Other | 958 | 928 | 1,134 | 1,055 | 1,150 |
| TOTAL | 8,851 | 8,899 | 9,383 | 9,260 | 9,378 |
| Discipline | 2013 | 2014 | 2015 | 2016 | 2017 |
|---|---|---|---|---|---|
| Biosystems | 152 | 164 | 171 | 184 | 283 |
| Chemical | 358 | 321 | 370 | 387 | 411 |
| Civil | 505 | 489 | 566 | 637 | 761 |
| Computer | 56 | 68 | 83 | 102 | 100 |
| Electrical | 721 | 789 | 840 | 873 | 949 |
| Engineering Physics | 42 | 45 | 44 | 44 | 53 |
| Environmental | 134 | 162 | 162 | 182 | 177 |
| Geological | 7 | 5 | 4 | 6 | 4 |
| Industrial or Manufacturing | 114 | 112 | 98 | 119 | 131 |
| Materials or Metallurgical | 77 | 68 | 66 | 65 | 62 |
| Mechanical | 276 | 328 | 383 | 417 | 434 |
| Mining or Mineral | 35 | 47 | 53 | 55 | 44 |
| Software | 54 | 66 | 86 | 97 | 131 |
| Other | 401 | 412 | 426 | 427 | 497 |
| TOTAL | 2,933 | 3,075 | 3,352 | 3,596 | 4,038 |
| Discipline | 2013 | 2014 | 2015 | 2016 | 2017 |
|---|---|---|---|---|---|
| Biosystems | 160 | 161 | 174 | 192 | 252 |
| Chemical | 351 | 327 | 316 | 315 | 323 |
| Civil | 317 | 337 | 350 | 356 | 371 |
| Computer | 36 | 33 | 46 | 53 | 50 |
| Electrical | 427 | 452 | 456 | 462 | 468 |
| Engineering Physics | 47 | 52 | 55 | 39 | 48 |
| Environmental | 51 | 44 | 52 | 55 | 51 |
| Geological | 3 | 2 | 1 | 0 | 1 |
| Industrial or Manufacturing | 39 | 42 | 53 | 51 | 50 |
| Materials or Metallurgical | 99 | 106 | 121 | 115 | 116 |
| Mechanical | 347 | 278 | 264 | 271 | 296 |
| Mining or Mineral | 26 | 36 | 36 | 40 | 34 |
| Software | 4 | 9 | 2 | 6 | 11 |
| Other | 204 | 226 | 250 | 236 | 267 |
| TOTAL | 2,112 | 2,104 | 2,177 | 2,193 | 2,339 |
| Discipline | 2013 | 2014 | 2015 | 2016 | 2017 |
|---|---|---|---|---|---|
| Biosystems | 130 | 117 | 127 | 138 | 221 |
| Chemical | 398 | 492 | 533 | 570 | 602 |
| Civil | 701 | 708 | 849 | 975 | 1,154 |
| Computer | 203 | 184 | 234 | 219 | 231 |
| Electrical | 1,904 | 2,200 | 2,390 | 2,360 | 2,474 |
| Engineering Physics | 67 | 61 | 73 | 64 | 67 |
| Environmental | 132 | 185 | 185 | 207 | 182 |
| Geological | 6 | 5 | 4 | 3 | 2 |
| Industrial or Manufacturing | 218 | 247 | 236 | 284 | 398 |
| Materials or Metallurgical | 124 | 109 | 103 | 111 | 105 |
| Mechanical | 913 | 1,056 | 1,352 | 1,494 | 1,818 |
| Mining or Mineral | 73 | 85 | 99 | 96 | 87 |
| Software | 184 | 231 | 258 | 246 | 303 |
| Other | 858 | 1,056 | 1,132 | 1,197 | 1,415 |
| TOTAL | 5,912 | 6,737 | 7,576 | 7,965 | 9,058 |
| Discipline | 2013 | 2014 | 2015 | 2016 | 2017 |
|---|---|---|---|---|---|
| Biosystems | 161 | 175 | 188 | 213 | 299 |
| Chemical | 481 | 523 | 553 | 607 | 625 |
| Civil | 613 | 678 | 738 | 735 | 815 |
| Computer | 80 | 76 | 113 | 134 | 143 |
| Electrical | 1,209 | 1,328 | 1,422 | 1,431 | 1,368 |
| Engineering Physics | 98 | 108 | 127 | 99 | 116 |
| Environmental | 61 | 63 | 62 | 81 | 71 |
| Geological | 5 | 1 | 2 | 0 | 2 |
| Industrial or Manufacturing | 100 | 98 | 113 | 96 | 87 |
| Materials or Metallurgical | 199 | 218 | 229 | 250 | 252 |
| Mechanical | 786 | 872 | 955 | 1,006 | 1,057 |
| Mining or Mineral | 49 | 61 | 65 | 75 | 62 |
| Software | 11 | 17 | 5 | 4 | 16 |
| Other | 450 | 494 | 641 | 628 | 727 |
| TOTAL | 4,300 | 4,712 | 5,213 | 5,359 | 5,641 |
| Province | 2013 | 2014 | 2015 | 2016 | 2017 |
|---|---|---|---|---|---|
| AB | 1,307 | 1,071 | 1,214 | 1,324 | 1,443 |
| BC | 848 | 857 | 1,065 | 871 | 906 |
| MB | 228 | 248 | 245 | 253 | 265 |
| NB | 171 | 133 | 151 | 139 | 134 |
| NL | 267 | 298 | 300 | 359 | 350 |
| NS | 418 | 389 | 367 | 366 | 385 |
| ON | 5,343 | 5,296 | 5,503 | 5,912 | 6,457 |
| QC | 3,799 | 4,023 | 4,479 | 4,578 | 5,088 |
| SK | 344 | 332 | 391 | 428 | 500 |
| TOTAL | 12,725 | 12,646 | 13,715 | 14,229 | 15,529 |
| Province | 2013 | 2014 | 2015 | 2016 | 2017 |
|---|---|---|---|---|---|
| AB | 1,141 | 1,081 | 1,101 | 1,103 | 1,137 |
| BC | 895 | 884 | 1,039 | 842 | 774 |
| MB | 214 | 214 | 240 | 245 | 243 |
| NB | 111 | 86 | 76 | 93 | 57 |
| NL | 127 | 151 | 165 | 213 | 221 |
| NS | 113 | 123 | 144 | 148 | 138 |
| ON | 3,294 | 3,394 | 3,424 | 3,455 | 3,338 |
| QC | 2,751 | 2,768 | 2,858 | 2,925 | 3,199 |
| SK | 206 | 200 | 337 | 237 | 272 |
| TOTAL | 8,851 | 8,899 | 9,383 | 9,260 | 9,378 |
| Province | 2013 | 2014 | 2015 | 2016 | 2017 |
|---|---|---|---|---|---|
| AB | 361 | 325 | 360 | 407 | 428 |
| BC | 194 | 197 | 243 | 226 | 248 |
| MB | 57 | 67 | 61 | 65 | 72 |
| NB | 35 | 24 | 41 | 36 | 30 |
| NL | 72 | 69 | 63 | 66 | 65 |
| NS | 61 | 62 | 78 | 86 | 93 |
| ON | 1,212 | 1,302 | 1,378 | 1,509 | 1,672 |
| QC | 847 | 943 | 1,029 | 1,098 | 1,313 |
| SK | 95 | 87 | 100 | 104 | 116 |
| TOTAL | 2,933 | 3,075 | 3,352 | 3,596 | 4,038 |
| Province | 2013 | 2014 | 2015 | 2016 | 2017 |
|---|---|---|---|---|---|
| AB | 332 | 276 | 255 | 263 | 298 |
| BC | 188 | 190 | 200 | 188 | 185 |
| MB | 42 | 44 | 50 | 54 | 56 |
| NB | 34 | 21 | 17 | 18 | 11 |
| NL | 23 | 32 | 34 | 41 | 34 |
| NS | 29 | 28 | 33 | 29 | 31 |
| ON | 743 | 766 | 792 | 801 | 830 |
| QC | 667 | 688 | 714 | 736 | 820 |
| SK | 53 | 60 | 83 | 63 | 74 |
| TOTAL | 2,112 | 2,104 | 2,177 | 2,193 | 2,339 |
| Province | 2013 | 2014 | 2015 | 2016 | 2017 |
|---|---|---|---|---|---|
| AB | 610 | 622 | 656 | 675 | 751 |
| BC | 459 | 502 | 665 | 540 | 589 |
| MB | 123 | 135 | 134 | 149 | 167 |
| NB | 87 | 68 | 60 | 49 | 55 |
| NL | 205 | 245 | 264 | 297 | 285 |
| NS | 294 | 268 | 255 | 274 | 295 |
| ON | 1,983 | 2,474 | 2,737 | 3,058 | 3,523 |
| QC | 1,916 | 2,183 | 2,538 | 2,644 | 3,066 |
| SK | 236 | 241 | 267 | 280 | 327 |
| TOTAL | 5,912 | 6,737 | 7,576 | 7,965 | 9,058 |
| Province | 2013 | 2014 | 2015 | 2016 | 2017 |
|---|---|---|---|---|---|
| AB | 485 | 719 | 721 | 777 | 842 |
| BC | 534 | 536 | 643 | 522 | 503 |
| MB | 123 | 135 | 148 | 153 | 167 |
| NB | 77 | 57 | 27 | 47 | 27 |
| NL | 80 | 105 | 125 | 160 | 178 |
| NS | 48 | 64 | 67 | 69 | 69 |
| ON | 1,358 | 1,454 | 1,587 | 1,634 | 1,613 |
| QC | 1,452 | 1,503 | 1,710 | 1,843 | 2,047 |
| SK | 143 | 139 | 187 | 154 | 195 |
| TOTAL | 4,300 | 4,712 | 5,213 | 5,359 | 5,641 |
| Discipline | AB | BC | MB | NB | NL | NS | ON | QC | SK | Total |
|---|---|---|---|---|---|---|---|---|---|---|
| Biosystems | 66 | 172 | 78 | 2 | 37 | 494 | 367 | 97 | 1,312 | |
| Chemical | 690 | 35 | 31 | 876 | 390 | 53 | 2,076 | |||
| Civil | 486 | 303 | 128 | 29 | 92 | 55 | 1,423 | 1,247 | 110 | 3,872 |
| Computer | 97 | 11 | 87 | 235 | 175 | 39 | 644 | |||
| Electrical | 379 | 447 | 183 | 33 | 66 | 77 | 2,805 | 1,828 | 111 | 5,929 |
| Engineering Physics | 58 | 117 | 10 | 70 | 151 | 406 | ||||
| Environmental | 27 | 14 | 12 | 227 | 162 | 50 | 491 | |||
| Geological | 4 | 12 | 16 | |||||||
| Industrial or Manufacturing | 10 | 26 | 177 | 477 | 59 | 748 | ||||
| Materials or Metallurgical | 103 | 93 | 16 | 187 | 239 | 638 | ||||
| Mechanical | 498 | 449 | 109 | 43 | 65 | 30 | 2,211 | 1,182 | 147 | 4,733 |
| Mining or Mineral | 46 | 81 | 7 | 63 | 99 | 296 | ||||
| Software | 79 | 355 | 21 | 456 | ||||||
| Other | 157 | -24 | 49 | 248 | 223 | 936 | 1,616 | 85 | 3,289 |
| Discipline | AB | BC | MB | NB | NL | NS | ON | QC | SK | Total |
|---|---|---|---|---|---|---|---|---|---|---|
| Biosystems | 28 | 63 | 30 | 1 | 20 | 205 | 156 | 32 | 534 | |
| Chemical | 243 | 7 | 10 | 313 | 141 | 20 | 735 | |||
| Civil | 159 | 82 | 33 | 8 | 20 | 21 | 419 | 357 | 34 | 1,132 |
| Computer | 28 | 5 | 15 | 55 | 37 | 11 | 150 | |||
| Electrical | 88 | 117 | 45 | 6 | 10 | 9 | 701 | 431 | 11 | 1,417 |
| Engineering Physics | 15 | 42 | 3 | 11 | 30 | 101 | ||||
| Environmental | 7 | 5 | 7 | 105 | 79 | 26 | 228 | |||
| Geological | 1 | 4 | 6 | |||||||
| Industrial or Manufacturing | 3 | 7 | 19 | 143 | 10 | 181 | ||||
| Materials or Metallurgical | 32 | 29 | 4 | 45 | 68 | 178 | ||||
| Mechanical | 91 | 75 | 17 | 7 | 6 | 4 | 338 | 175 | 15 | 729 |
| Mining or Mineral | 4 | 25 | 2 | 17 | 31 | 78 | ||||
| Software | 20 | 116 | 6 | 142 | ||||||
| Other | 39 | -12 | 12 | 43 | 38 | 250 | 370 | 25 | 765 |
| Institution | 2013 | 2014 | 2015 | 2016 | 2017 |
|---|---|---|---|---|---|
| Alberta | 1,493 | 1,344 | 1,317 | 1,334 | 1,383 |
| Calgary | 898 | 788 | 998 | 989 | 1,046 |
| Carleton | 717 | 727 | 757 | 831 | 847 |
| Concordia | 1,752 | 1,879 | 2,102 | 2,184 | 2,492 |
| Dal | 520 | 487 | 489 | 506 | 518 |
| ETS | 918 | 1,116 | 1,249 | 1,287 | 1,296 |
| Guelph | 128 | 155 | 161 | 169 | 195 |
| Lakehead | 41 | 56 | 74 | 158 | |
| Laurentian | 31 | 50 | 37 | 42 | 44 |
| Laval | 531 | 531 | 494 | 504 | 519 |
| Manitoba | 429 | 452 | 477 | 488 | 499 |
| McGill | 969 | 842 | 846 | 872 | 1,109 |
| McMaster | 639 | 697 | 731 | 741 | 795 |
| Moncton | 15 | 10 | 18 | 15 | 25 |
| MUN | 363 | 423 | 465 | 547 | 550 |
| NSAC | 0 | 0 | |||
| Ottawa | 810 | 918 | 904 | 885 | 860 |
| Polytechnique | 1,288 | 1,314 | 1,400 | 1,413 | 1,455 |
| Queen's | 446 | 471 | 468 | 456 | 331 |
| Regina | 182 | 188 | 231 | 179 | 216 |
| RMC | 88 | 92 | 95 | 86 | 70 |
| Ryerson | 707 | 551 | 584 | 600 | 656 |
| Saskatchewan | 342 | 324 | 425 | 463 | 521 |
| SFU | 190 | 194 | 181 | 177 | 173 |
| Sherbrooke | 492 | 485 | 540 | 544 | 486 |
| SMU | 2 | 7 | 7 | 4 | |
| Toronto | 1,688 | 1,839 | 1,900 | 1,989 | 2,040 |
| UBC | 1,074 | 1,037 | 984 | 917 | 992 |
| UBCO | 142 | 164 | 549 | 202 | 192 |
| UNB | 221 | 166 | 163 | 186 | 148 |
| UOIT | 214 | 158 | 174 | 191 | 172 |
| UQAC | 147 | 94 | 211 | 196 | 383 |
| UQAM | 18 | ||||
| UQAR | 15 | 22 | 25 | 35 | 53 |
| UQAT | 23 | 28 | 29 | 57 | 64 |
| UQTR | 110 | 117 | 125 | 126 | 118 |
| UVic | 324 | 304 | 337 | 335 | 264 |
| Waterloo | 1,339 | 1,290 | 1,261 | 1,310 | 1,409 |
| Western | 574 | 582 | 708 | 657 | 757 |
| Windsor | 628 | 670 | 717 | 885 | 1,228 |
| York | 6 | 17 | 24 | 46 | 74 |
| TOTAL | 20,493 | 20,601 | 22,254 | 22,610 | 23,984 |
| Institution | 2013 | 2014 | 2015 | 2016 | 2017 |
| Alberta | 0 | 0 | 0 | 0 | 78 |
| Calgary | 158 | 33 | 0 | 261 | 242 |
| Carleton | 139 | 140 | 128 | 120 | 106 |
| Concordia | 87 | 107 | 136 | 124 | 89 |
| Dal | 12 | 40 | 13 | 29 | 22 |
| ETS | 364 | 387 | 365 | 324 | 323 |
| Guelph | 27 | 28 | 24 | 24 | 29 |
| Lakehead | 1 | 0 | 0 | 0 | |
| Laurentian | 26 | 0 | 1 | 10 | 7 |
| Laval | 41 | 39 | 42 | 31 | 33 |
| Manitoba | 43 | 37 | 31 | 35 | 33 |
| McGill | 0 | 48 | 56 | 55 | 73 |
| McMaster | 433 | 107 | 97 | 65 | 64 |
| Moncton | 0 | 9 | 6 | 6 | 0 |
| MUN | 58 | 76 | 76 | 72 | 62 |
| NSAC | 0 | 0 | |||
| Ottawa | 101 | 109 | 131 | 93 | 79 |
| Polytechnique | 112 | 114 | 127 | 126 | 126 |
| Queen's | 50 | 35 | 34 | 36 | 20 |
| Regina | 41 | 38 | 39 | 44 | 63 |
| RMC | 17 | 23 | 25 | 26 | 28 |
| Ryerson | 150 | 79 | 72 | 70 | 68 |
| Saskatchewan | 0 | 0 | 0 | 0 | 0 |
| SFU | 14 | 18 | 27 | 27 | 46 |
| Sherbrooke | 145 | 0 | 0 | 221 | 115 |
| SMU | 0 | 0 | 1 | 1 | |
| Toronto | 201 | 168 | 146 | 153 | 155 |
| UBC | 26 | 105 | 105 | 193 | 81 |
| UBCO | 0 | 0 | 2 | 2 | 14 |
| UNB | 41 | 42 | 45 | 31 | 17 |
| UOIT | 63 | 61 | 72 | 65 | 70 |
| UQAC | 0 | 5 | 0 | 8 | 16 |
| UQAM | 0 | ||||
| UQAR | 2 | 0 | 1 | 0 | 0 |
| UQAT | 0 | 2 | 2 | 0 | 0 |
| UQTR | 114 | 76 | 38 | 19 | 18 |
| UVic | 0 | 0 | 0 | 0 | -12 |
| Waterloo | 375 | 304 | 278 | 277 | 284 |
| Western | 37 | 27 | 29 | 11 | 48 |
| Windsor | 23 | 28 | 23 | 20 | 17 |
| York | 2 | 3 | 4 | 13 | 13 |
| TOTAL | 2,904 | 2,286 | 2,175 | 2,591 | 2,431 |
| Institution | 2013 | 2014 | 2015 | 2016 | 2017 |
| Alberta | 438 | 378 | 347 | 341 | 371 |
| Calgary | 246 | 219 | 268 | 304 | 320 |
| Carleton | 152 | 163 | 177 | 208 | 234 |
| Concordia | 391 | 440 | 489 | 529 | 637 |
| Dal | 88 | 89 | 108 | 115 | 124 |
| ETS | 186 | 270 | 293 | 320 | 325 |
| Guelph | 30 | 43 | 49 | 47 | 53 |
| Lakehead | 4 | 9 | 14 | 29 | |
| Laurentian | 3 | 10 | 8 | 9 | 13 |
| Laval | 116 | 116 | 127 | 133 | 141 |
| Manitoba | 97 | 108 | 109 | 117 | 127 |
| McGill | 206 | 194 | 197 | 211 | 319 |
| McMaster | 171 | 186 | 190 | 197 | 219 |
| Moncton | 2 | 2 | 4 | 3 | 6 |
| MUN | 89 | 97 | 98 | 104 | 95 |
| NSAC | 0 | 0 | |||
| Ottawa | 203 | 252 | 245 | 233 | 244 |
| Polytechnique | 379 | 380 | 378 | 383 | 419 |
| Queen's | 100 | 104 | 105 | 109 | 85 |
| Regina | 53 | 55 | 52 | 53 | 68 |
| RMC | 17 | 15 | 15 | 16 | 11 |
| Ryerson | 115 | 117 | 133 | 156 | 163 |
| Saskatchewan | 89 | 86 | 107 | 109 | 113 |
| SFU | 41 | 45 | 46 | 49 | 50 |
| Sherbrooke | 83 | 87 | 88 | 96 | 91 |
| SMU | 0 | 0 | 0 | 0 | |
| Toronto | 440 | 492 | 527 | 547 | 557 |
| UBC | 262 | 261 | 258 | 243 | 276 |
| UBCO | 23 | 20 | 68 | 25 | 37 |
| UNB | 56 | 34 | 44 | 43 | 34 |
| UOIT | 41 | 33 | 38 | 32 | 34 |
| UQAC | 40 | 29 | 66 | 53 | 81 |
| UQAM | 2 | ||||
| UQAR | 1 | 2 | 3 | 5 | 5 |
| UQAT | 4 | 4 | 5 | 11 | 11 |
| UQTR | 28 | 26 | 29 | 27 | 23 |
| UVic | 53 | 53 | 60 | 77 | 60 |
| Waterloo | 303 | 292 | 286 | 326 | 369 |
| Western | 146 | 152 | 190 | 176 | 250 |
| Windsor | 110 | 105 | 126 | 152 | 179 |
| York | 1 | 5 | 7 | 12 | 23 |
| TOTAL | 4,806 | 4,975 | 5,352 | 5,598 | 6,166 |
| Institution | 2013 | 2014 | 2015 | 2016 | 2017 |
|---|---|---|---|---|---|
| Alberta | 0 | 0 | 0 | 0 | 19 |
| Calgary | 24 | 6 | 0 | 60 | 57 |
| Carleton | 24 | 31 | 30 | 19 | 20 |
| Concordia | 13 | 18 | 23 | 26 | 18 |
| Dal | 3 | 1 | 2 | 5 | 4 |
| ETS | 80 | 90 | 80 | 67 | 74 |
| Guelph | 11 | 12 | 8 | 8 | 12 |
| Lakehead | 0 | 0 | 0 | 0 | |
| Laurentian | 4 | 0 | 0 | 2 | 0 |
| Laval | 6 | 8 | 7 | 10 | 9 |
| Manitoba | 8 | 8 | 5 | 7 | 7 |
| McGill | 0 | 6 | 9 | 14 | 24 |
| McMaster | 70 | 23 | 17 | 13 | 10 |
| Moncton | 0 | 2 | 2 | 2 | 0 |
| MUN | 11 | 13 | 9 | 9 | 10 |
| NSAC | 0 | 0 | |||
| Ottawa | 20 | 27 | 32 | 24 | 23 |
| Polytechnique | 30 | 40 | 43 | 37 | 37 |
| Queen's | 11 | 6 | 6 | 5 | 2 |
| Regina | 10 | 10 | 9 | 10 | 16 |
| RMC | 0 | 7 | 6 | 6 | 2 |
| Ryerson | 19 | 14 | 11 | 7 | 8 |
| Saskatchewan | 0 | 0 | 0 | 0 | 0 |
| SFU | 1 | 2 | 4 | 6 | 13 |
| Sherbrooke | 32 | 0 | 0 | 42 | 21 |
| SMU | 0 | 0 | 0 | 0 | |
| Toronto | 47 | 38 | 28 | 27 | 28 |
| UBC | 8 | 28 | 30 | 46 | 24 |
| UBCO | 0 | 0 | 0 | 0 | 1 |
| UNB | 10 | 10 | 10 | 7 | 2 |
| UOIT | 12 | 8 | 11 | 9 | 11 |
| UQAC | 0 | 3 | 0 | 2 | 2 |
| UQAM | 0 | ||||
| UQAR | 1 | 0 | 0 | 0 | 0 |
| UQAT | 0 | 0 | 0 | 0 | 0 |
| UQTR | 64 | 44 | 18 | 6 | 3 |
| UVic | 0 | 0 | 0 | 0 | -6 |
| Waterloo | 70 | 56 | 53 | 60 | 68 |
| Western | 11 | 6 | 8 | 2 | 14 |
| Windsor | 2 | 2 | 2 | 3 | 4 |
| York | 1 | 2 | 1 | 3 | 4 |
| TOTAL | 603 | 520 | 462 | 545 | 539 |
| Institution |
Biosystems
|
Chemical
|
Civil
|
Computer
|
Electrical
|
Engineering Physics
|
Environmental
|
Geological
|
Industrial or Manufacturing
|
Materials or Metallurgical
|
Mechanical
|
Mining or Mineral
|
Software
|
Other
|
|---|---|---|---|---|---|---|---|---|---|---|---|---|---|---|
| Alberta | -12 | 220 | 336 | 94 | 181 | 57 | 100 | 285 | 45 | 77 | ||||
| Calgary | 90 | 414 | 119 | 179 | 170 | 73 | ||||||||
| Carleton | 123 | 9 | 400 | 37 | 5 | 106 | 37 | 130 | ||||||
| Concordia | 586 | 857 | 169 | 432 | 306 | 142 | ||||||||
| Dal | 37 | 31 | 55 | 77 | 5 | 12 | 26 | 16 | 30 | 7 | 223 | |||
| ETS | 94 | 124 | 71 | 45 | 87 | 33 | 843 | |||||||
| Guelph | 30 | 41 | 85 | 39 | ||||||||||
| Laurentian | 44 | |||||||||||||
| Laval | 76 | 103 | 111 | 48 | 62 | 105 | 12 | 2 | ||||||
| Manitoba | 77 | 125 | 179 | 10 | 109 | |||||||||
| McGill | 264 | 113 | 97 | 294 | 148 | 189 | 5 | |||||||
| McMaster | 58 | 85 | 69 | 81 | 126 | 58 | 8 | 64 | 113 | 40 | 93 | |||
| Moncton | 25 | |||||||||||||
| MUN | 89 | 85 | 62 | 14 | 61 | 240 | ||||||||
| Ottawa | 33 | 93 | 156 | 328 | 68 | 114 | 68 | |||||||
| Polytechnique | 96 | 120 | 173 | 172 | 189 | 151 | 201 | 24 | 198 | 86 | 46 | |||
| Queen's | 52 | 68 | 78 | 11 | 12 | 94 | 16 | |||||||
| Regina | 31 | 41 | 51 | 18 | 76 | |||||||||
| RMC | 15 | 9 | 29 | 6 | 11 | |||||||||
| Ryerson | 28 | 37 | 129 | 78 | 159 | 105 | 118 | |||||||
| Saskatchewan | 97 | 53 | 110 | 111 | 4 | 147 | ||||||||
| SFU | 91 | 83 | ||||||||||||
| Sherbrooke | 57 | 130 | 151 | 137 | 11 | |||||||||
| SMU | 4 | |||||||||||||
| Toronto | 265 | 227 | 275 | 485 | 87 | 538 | 163 | |||||||
| UBC | 170 | 193 | 295 | 27 | 3 | 93 | 136 | 75 | ||||||
| UBCO | 82 | 48 | 62 | |||||||||||
| UNB | 2 | 33 | 26 | 30 | 39 | 19 | ||||||||
| UOIT | 66 | 70 | 36 | |||||||||||
| UQAC | 36 | 347 | ||||||||||||
| UQAR | 53 | |||||||||||||
| UQAT | 64 | |||||||||||||
| UQTR | 21 | 51 | 33 | 13 | ||||||||||
| UVic | 18 | 11 | 97 | 151 | -12 | |||||||||
| Waterloo | 206 | 185 | 445 | 314 | 258 | |||||||||
| Western | 74 | 148 | 208 | 222 | 106 | |||||||||
| Windsor | 115 | 372 | 29 | 166 | 30 | 516 | ||||||||
| York | 30 | 14 | 30 | |||||||||||
| TOTAL | 1,307 | 1,999 | 3,701 | 616 | 5,746 | 377 | 471 | 15 | 708 | 629 | 4,585 | 285 | 433 | 3,112 |
| Institution |
Biosystems
|
Chemical
|
Civil
|
Computer
|
Electrical
|
Engineering Physics
|
Environmental
|
Geological
|
Mechanical
|
Industrial or Manufacturing
|
Materials or Metallurgical
|
Mining or Mineral
|
Software
|
Other
|
|---|---|---|---|---|---|---|---|---|---|---|---|---|---|---|
| Alberta | -12 | 16 | 38 | 1 | 7 | 4 | 20 | 1 | 3 | |||||
| Calgary | 105 | 23 | 40 | 66 | 8 | |||||||||
| Carleton | 20 | 1 | 55 | 6 | 1 | 11 | 12 | |||||||
| Concordia | 33 | 17 | 2 | 11 | 13 | 13 | ||||||||
| Dal | 1 | 1 | 4 | 4 | 1 | 3 | 0 | 8 | ||||||
| ETS | 53 | 43 | 16 | 12 | 19 | 17 | 163 | |||||||
| Guelph | 5 | 5 | 18 | 2 | ||||||||||
| Laurentian | 7 | |||||||||||||
| Laval | 10 | 7 | 3 | 5 | 5 | 1 | 2 | |||||||
| Manitoba | 3 | 9 | 16 | 1 | 5 | |||||||||
| McGill | 13 | 4 | 14 | 11 | 6 | 7 | 18 | |||||||
| McMaster | 1 | 8 | 8 | 8 | 2 | 6 | 0 | 8 | 6 | 16 | ||||
| Moncton | ||||||||||||||
| MUN | 8 | 6 | 12 | 11 | 25 | |||||||||
| Ottawa | 1 | 4 | 10 | 38 | 2 | 8 | 17 | |||||||
| Polytechnique | 2 | 4 | 26 | 7 | 18 | 1 | 43 | 6 | 2 | 17 | ||||
| Queen's | 1 | 3 | 7 | 0 | 5 | 5 | ||||||||
| Regina | 14 | 10 | 16 | 7 | 16 | |||||||||
| RMC | 9 | 2 | 16 | 1 | ||||||||||
| Ryerson | 2 | 2 | 14 | 8 | 19 | 11 | 13 | |||||||
| Saskatchewan | ||||||||||||||
| SFU | 33 | 13 | ||||||||||||
| Sherbrooke | 115 | |||||||||||||
| SMU | 1 | |||||||||||||
| Toronto | 5 | 8 | 39 | 53 | 2 | 44 | 5 | |||||||
| UBC | 12 | 22 | 17 | 1 | 4 | 1 | 7 | 17 | ||||||
| UBCO | 6 | 4 | 4 | |||||||||||
| UNB | 2 | 3 | 3 | 4 | 5 | |||||||||
| UOIT | 13 | 23 | 34 | |||||||||||
| UQAC | 0 | 16 | ||||||||||||
| UQAR | ||||||||||||||
| UQAT | ||||||||||||||
| UQTR | 1 | 7 | 8 | 2 | ||||||||||
| UVic | -12 | |||||||||||||
| Waterloo | 15 | 40 | 87 | 54 | 88 | |||||||||
| Western | 4 | 8 | 14 | 12 | 0 | 9 | ||||||||
| Windsor | 5 | 3 | 1 | 2 | 1 | 4 | ||||||||
| York | 6 | 5 | 2 | |||||||||||
| TOTAL | 37 | 181 | 411 | 54 | 516 | 38 | 57 | 4 | 94 | 21 | 360 | 32 | 44 | 583 |
| Institution |
Biosystems
|
Chemical
|
Civil
|
Computer
|
Electrical
|
Engineering Physics
|
Environmental
|
Geological
|
Mechanical
|
Industrial or Manufacturing
|
Materials or Metallurgical
|
Mining or Mineral
|
Software
|
Other
|
|---|---|---|---|---|---|---|---|---|---|---|---|---|---|---|
| Alberta | -6 | 89 | 107 | 27 | 32 | 15 | 31 | 53 | 4 | 19 | ||||
| Calgary | 40 | 135 | 43 | 51 | 33 | 18 | ||||||||
| Carleton | 29 | 7 | 121 | 22 | 1 | 17 | 10 | 27 | ||||||
| Concordia | 164 | 252 | 32 | 49 | 107 | 33 | ||||||||
| Dal | 20 | 10 | 21 | 9 | 3 | 7 | 7 | 4 | 4 | 2 | 38 | |||
| ETS | 23 | 20 | 41 | 10 | 7 | 7 | 218 | |||||||
| Guelph | 10 | 9 | 31 | 4 | ||||||||||
| Laurentian | 13 | |||||||||||||
| Laval | 22 | 29 | 19 | 23 | 21 | 24 | 3 | |||||||
| Manitoba | 30 | 32 | 45 | 3 | 17 | |||||||||
| McGill | 112 | 44 | 32 | 61 | 40 | 29 | 2 | |||||||
| McMaster | 27 | 26 | 18 | 17 | 30 | 10 | 1 | 24 | 21 | 10 | 35 | |||
| Moncton | 6 | |||||||||||||
| MUN | 19 | 15 | 10 | 5 | 5 | 42 | ||||||||
| Ottawa | 11 | 35 | 32 | 106 | 34 | 10 | 17 | |||||||
| Polytechnique | 40 | 50 | 62 | 36 | 37 | 30 | 83 | 6 | 41 | 28 | 7 | |||
| Queen's | 21 | 19 | 14 | 1 | 4 | 22 | 3 | |||||||
| Regina | 8 | 23 | 9 | 5 | 23 | |||||||||
| RMC | 4 | 2 | 1 | 3 | 1 | |||||||||
| Ryerson | 13 | 13 | 38 | 16 | 38 | 21 | 24 | |||||||
| Saskatchewan | 32 | 20 | 34 | 11 | 1 | 15 | ||||||||
| SFU | 34 | 16 | ||||||||||||
| Sherbrooke | 19 | 29 | 20 | 23 | ||||||||||
| SMU | ||||||||||||||
| Toronto | 114 | 89 | 90 | 104 | 15 | 122 | 22 | |||||||
| UBC | 62 | 61 | 69 | 7 | 1 | 29 | 23 | 24 | ||||||
| UBCO | 15 | 15 | 7 | |||||||||||
| UNB | 1 | 7 | 8 | 6 | 7 | 5 | ||||||||
| UOIT | 14 | 8 | 12 | |||||||||||
| UQAC | 11 | 70 | ||||||||||||
| UQAR | 5 | |||||||||||||
| UQAT | 11 | |||||||||||||
| UQTR | 6 | 8 | 8 | 1 | ||||||||||
| UVic | 4 | 5 | 31 | 27 | -6 | |||||||||
| Waterloo | 61 | 62 | 100 | 49 | 96 | |||||||||
| Western | 28 | 62 | 84 | 54 | 23 | |||||||||
| Windsor | 17 | 106 | 14 | 17 | 4 | 20 | ||||||||
| York | 11 | 3 | 8 | |||||||||||
| TOTAL | 533 | 711 | 1,085 | 142 | 1,383 | 93 | 219 | 5 | 170 | 176 | 708 | 77 | 139 | 726 |
| Institution |
Biosystems
|
Chemical
|
Civil
|
Computer
|
Electrical
|
Engineering Physics
|
Environmental
|
Geological
|
Mechanical
|
Industrial or Manufacturing
|
Materials or Metallurgical
|
Mining or Mineral
|
Software
|
Other
|
|---|---|---|---|---|---|---|---|---|---|---|---|---|---|---|
| Alberta | -6 | 9 | 7 | 3 | 1 | 5 | ||||||||
| Calgary | 31 | 8 | 11 | 6 | 1 | |||||||||
| Carleton | 2 | 1 | 8 | 4 | 1 | 4 | ||||||||
| Concordia | 8 | 5 | 1 | 1 | 3 | |||||||||
| Dal | 1 | 1 | 2 | |||||||||||
| ETS | 13 | 8 | 9 | 2 | 1 | 41 | ||||||||
| Guelph | 2 | 9 | ||||||||||||
| Laurentian | ||||||||||||||
| Laval | 3 | 4 | 1 | 1 | ||||||||||
| Manitoba | 1 | 4 | 2 | 1 | ||||||||||
| McGill | 8 | 1 | 4 | 3 | 2 | 1 | 4 | |||||||
| McMaster | 0 | 3 | 1 | 0 | 1 | 2 | 1 | 2 | ||||||
| Moncton | ||||||||||||||
| MUN | 2 | 4 | 3 | |||||||||||
| Ottawa | 1 | 2 | 1 | 12 | 1 | 1 | 6 | |||||||
| Polytechnique | 1 | 0 | 9 | 2 | 4 | 17 | 1 | 1 | 1 | |||||
| Queen's | 0 | 1 | 1 | |||||||||||
| Regina | 6 | 4 | 1 | 2 | 4 | |||||||||
| RMC | 2 | |||||||||||||
| Ryerson | 0 | 2 | 2 | 1 | 2 | 1 | ||||||||
| Saskatchewan | ||||||||||||||
| SFU | 11 | 2 | ||||||||||||
| Sherbrooke | 21 | |||||||||||||
| SMU | ||||||||||||||
| Toronto | 1 | 2 | 10 | 6 | 1 | 8 | 0 | |||||||
| UBC | 6 | 6 | 5 | 1 | 2 | 1 | 1 | 2 | ||||||
| UBCO | 1 | 0 | ||||||||||||
| UNB | 0 | 0 | 0 | 0 | 1 | |||||||||
| UOIT | 2 | 2 | 6 | |||||||||||
| UQAC | 0 | 2 | ||||||||||||
| UQAR | ||||||||||||||
| UQAT | ||||||||||||||
| UQTR | 3 | |||||||||||||
| UVic | -6 | |||||||||||||
| Waterloo | 2 | 13 | 10 | 8 | 34 | |||||||||
| Western | 1 | 2 | 8 | 1 | 1 | |||||||||
| Windsor | 2 | 0 | 2 | |||||||||||
| York | 1 | 2 | 1 | |||||||||||
| TOTAL | 15 | 52 | 108 | 14 | 88 | 11 | 29 | 2 | 27 | 7 | 52 | 4 | 5 | 127 |
Post-graduate Degrees Awarded (GD)
| Discipline | 2013 | 2014 | 2015 | 2016 | 2017 |
|---|---|---|---|---|---|
| Biosystems | 186 | 153 | 159 | 160 | 270 |
| Chemical | 424 | 469 | 463 | 492 | 468 |
| Civil | 879 | 902 | 874 | 939 | 1,054 |
| Computer | 183 | 168 | 185 | 171 | 165 |
| Electrical | 1,441 | 1,619 | 1,539 | 1,796 | 1,801 |
| Engineering Physics | 75 | 64 | 61 | 67 | 72 |
| Environmental | 129 | 152 | 180 | 200 | 142 |
| Geological | 8 | 9 | 11 | 14 | 18 |
| Industrial or Manufacturing | 236 | 237 | 268 | 204 | 218 |
| Materials or Metallurgical | 97 | 119 | 93 | 90 | 96 |
| Mechanical | 834 | 950 | 1,062 | 1,255 | 1,296 |
| Mining or Mineral | 88 | 56 | 83 | 83 | 70 |
| Software | 88 | 124 | 149 | 173 | 157 |
| Other | 828 | 945 | 1,126 | 895 | 1,017 |
| Year One/Two Common Year | 11 | 0 | 0 | ||
| TOTAL | 5,496 | 5,978 | 6,253 | 6,539 | 6,844 |
| Discipline | 2013 | 2014 | 2015 | 2016 | 2017 |
|---|---|---|---|---|---|
| Biosystems | 60 | 50 | 66 | 62 | 102 |
| Chemical | 169 | 185 | 174 | 200 | 219 |
| Civil | 187 | 171 | 213 | 259 | 234 |
| Computer | 22 | 28 | 32 | 32 | 34 |
| Electrical | 389 | 384 | 368 | 387 | 440 |
| Engineering Physics | 43 | 48 | 36 | 33 | 30 |
| Environmental | 14 | 18 | 20 | 19 | 24 |
| Geological | 0 | 1 | 1 | 1 | 2 |
| Industrial or Manufacturing | 24 | 27 | 31 | 34 | 40 |
| Materials or Metallurgical | 48 | 71 | 49 | 37 | 71 |
| Mechanical | 236 | 260 | 264 | 290 | 352 |
| Mining or Mineral | 29 | 14 | 18 | 27 | 16 |
| Software | 3 | 3 | 3 | 2 | 3 |
| Other | 106 | 124 | 146 | 163 | 146 |
| Year One/Two Common Year | 5 | 0 | 0 | ||
| TOTAL | 1,330 | 1,389 | 1,421 | 1,546 | 1,713 |
| Discipline | 2013 | 2014 | 2015 | 2016 | 2017 |
|---|---|---|---|---|---|
| Biosystems | 74 | 66 | 63 | 69 | 111 |
| Chemical | 145 | 180 | 167 | 187 | 154 |
| Civil | 214 | 247 | 235 | 299 | 283 |
| Computer | 31 | 35 | 45 | 30 | 26 |
| Electrical | 305 | 354 | 363 | 432 | 495 |
| Engineering Physics | 16 | 14 | 14 | 16 | 14 |
| Environmental | 48 | 69 | 77 | 101 | 61 |
| Geological | 2 | 4 | 4 | 5 | 8 |
| Industrial or Manufacturing | 104 | 71 | 99 | 49 | 66 |
| Materials or Metallurgical | 30 | 39 | 26 | 30 | 21 |
| Mechanical | 105 | 132 | 146 | 190 | 185 |
| Mining or Mineral | 16 | 17 | 17 | 17 | 18 |
| Software | 15 | 23 | 40 | 36 | 45 |
| Other | 170 | 195 | 238 | 204 | 253 |
| Year One/Two Common Year | 7 | 0 | 0 | ||
| TOTAL | 1,275 | 1,453 | 1,534 | 1,665 | 1,740 |
| Discipline | 2013 | 2014 | 2015 | 2016 | 2017 |
|---|---|---|---|---|---|
| Biosystems | 25 | 16 | 21 | 21 | 36 |
| Chemical | 39 | 65 | 61 | 72 | 71 |
| Civil | 32 | 31 | 49 | 63 | 67 |
| Computer | 6 | 7 | 3 | 11 | 7 |
| Electrical | 45 | 54 | 60 | 62 | 83 |
| Engineering Physics | 4 | 8 | 12 | 11 | 4 |
| Environmental | 3 | 4 | 4 | 7 | 12 |
| Geological | 0 | 0 | 0 | 0 | 0 |
| Industrial or Manufacturing | 3 | 7 | 9 | 8 | 7 |
| Materials or Metallurgical | 10 | 21 | 15 | 13 | 21 |
| Mechanical | 34 | 49 | 49 | 53 | 56 |
| Mining or Mineral | 5 | 1 | 3 | 8 | 8 |
| Software | 2 | 2 | 0 | 0 | 0 |
| Other | 12 | 23 | 28 | 37 | 29 |
| Year One/Two Common Year | 0 | 0 | 0 | ||
| TOTAL | 220 | 288 | 314 | 366 | 401 |
| Discipline | 2013 | 2014 | 2015 | 2016 | 2017 |
|---|---|---|---|---|---|
| Biosystems | 61 | 61 | 50 | 55 | 78 |
| Chemical | 156 | 248 | 264 | 263 | 278 |
| Civil | 269 | 328 | 354 | 413 | 447 |
| Computer | 74 | 99 | 95 | 105 | 73 |
| Electrical | 756 | 1,031 | 966 | 1,237 | 1,312 |
| Engineering Physics | 24 | 20 | 22 | 30 | 24 |
| Environmental | 69 | 78 | 107 | 118 | 75 |
| Geological | 2 | 2 | 2 | 6 | 5 |
| Industrial or Manufacturing | 83 | 114 | 120 | 108 | 160 |
| Materials or Metallurgical | 48 | 52 | 39 | 50 | 46 |
| Mechanical | 314 | 436 | 530 | 748 | 776 |
| Mining or Mineral | 38 | 37 | 47 | 39 | 36 |
| Software | 51 | 75 | 118 | 136 | 106 |
| Other | 426 | 551 | 723 | 601 | 643 |
| Year One/Two Common Year | 9 | 0 | 0 | ||
| TOTAL | 2,371 | 3,141 | 3,437 | 3,909 | 4,059 |
| Discipline | 2013 | 2014 | 2015 | 2016 | 2017 |
|---|---|---|---|---|---|
| Biosystems | 13 | 11 | 15 | 17 | 35 |
| Chemical | 56 | 56 | 65 | 93 | 103 |
| Civil | 35 | 48 | 84 | 88 | 96 |
| Computer | 6 | 10 | 12 | 12 | 20 |
| Electrical | 110 | 122 | 137 | 180 | 252 |
| Engineering Physics | 11 | 18 | 13 | 11 | 13 |
| Environmental | 4 | 9 | 11 | 4 | 14 |
| Geological | 0 | 0 | 0 | 0 | 0 |
| Industrial or Manufacturing | 5 | 10 | 12 | 12 | 17 |
| Materials or Metallurgical | 20 | 28 | 20 | 22 | 43 |
| Mechanical | 60 | 96 | 97 | 129 | 192 |
| Mining or Mineral | 9 | 5 | 5 | 11 | 6 |
| Software | 2 | 2 | 1 | 0 | 2 |
| Other | 31 | 44 | 72 | 63 | 68 |
| Year One/Two Common Year | 4 | 0 | 0 | ||
| TOTAL | 362 | 463 | 544 | 642 | 861 |
| Province | 2013 | 2014 | 2015 | 2016 | 2017 |
|---|---|---|---|---|---|
| AB | 460 | 494 | 433 | 407 | 410 |
| BC | 340 | 317 | 345 | 380 | 377 |
| MB | 62 | 74 | 89 | 76 | 78 |
| NB | 50 | 67 | 24 | 54 | 64 |
| NL | 103 | 120 | 131 | 134 | 48 |
| NS | 173 | 217 | 341 | 133 | 183 |
| ON | 2,652 | 2,905 | 3,057 | 3,330 | 3,494 |
| PE | 0 | ||||
| QC | 1,537 | 1,644 | 1,689 | 1,885 | 2,054 |
| SK | 119 | 140 | 144 | 140 | 136 |
| TOTAL | 5,496 | 5,978 | 6,253 | 6,539 | 6,844 |
| Province | 2013 | 2014 | 2015 | 2016 | 2017 |
|---|---|---|---|---|---|
| AB | 203 | 221 | 153 | 205 | 188 |
| BC | 126 | 111 | 116 | 117 | 122 |
| MB | 28 | 29 | 27 | 52 | 41 |
| NB | 18 | 16 | 11 | 11 | 12 |
| NL | 12 | 14 | 19 | 16 | 17 |
| NS | 16 | 18 | 19 | 26 | 24 |
| ON | 552 | 520 | 615 | 651 | 796 |
| PE | 0 | ||||
| QC | 354 | 425 | 425 | 438 | 484 |
| SK | 21 | 35 | 36 | 30 | 29 |
| TOTAL | 1,330 | 1,389 | 1,421 | 1,546 | 1,713 |
| Province | 2013 | 2014 | 2015 | 2016 | 2017 |
|---|---|---|---|---|---|
| AB | 106 | 145 | 116 | 139 | 122 |
| BC | 87 | 75 | 70 | 79 | 96 |
| MB | 14 | 14 | 21 | 21 | 20 |
| NB | 12 | 17 | 5 | 9 | 19 |
| NL | 28 | 28 | 34 | 36 | 7 |
| NS | 27 | 26 | 40 | 28 | 45 |
| ON | 578 | 732 | 755 | 892 | 872 |
| PE | 0 | ||||
| QC | 389 | 370 | 451 | 423 | 524 |
| SK | 34 | 46 | 42 | 38 | 35 |
| TOTAL | 1,275 | 1,453 | 1,534 | 1,665 | 1,740 |
| Province | 2013 | 2014 | 2015 | 2016 | 2017 |
|---|---|---|---|---|---|
| AB | 31 | 44 | 35 | 46 | 41 |
| BC | 27 | 25 | 20 | 24 | 21 |
| MB | 4 | 6 | 3 | 6 | 11 |
| NB | 3 | 4 | 3 | 4 | 5 |
| NL | 2 | 3 | 0 | 3 | 4 |
| NS | 5 | 4 | 4 | 12 | 3 |
| ON | 90 | 103 | 143 | 152 | 183 |
| PE | 0 | ||||
| QC | 51 | 90 | 100 | 112 | 121 |
| SK | 7 | 9 | 6 | 7 | 12 |
| TOTAL | 220 | 288 | 314 | 366 | 401 |
| Province | 2013 | 2014 | 2015 | 2016 | 2017 |
|---|---|---|---|---|---|
| AB | 215 | 279 | 242 | 231 | 220 |
| BC | 164 | 142 | 177 | 235 | 211 |
| MB | 28 | 48 | 46 | 41 | 43 |
| NB | 31 | 35 | 20 | 31 | 32 |
| NL | 87 | 103 | 113 | 112 | 38 |
| NS | 137 | 173 | 284 | 96 | 139 |
| ON | 946 | 1,398 | 1,532 | 1,902 | 2,030 |
| PE | 0 | ||||
| QC | 676 | 862 | 908 | 1,153 | 1,254 |
| SK | 87 | 101 | 115 | 108 | 92 |
| TOTAL | 2,371 | 3,141 | 3,437 | 3,909 | 4,059 |
| Province | 2013 | 2014 | 2015 | 2016 | 2017 |
|---|---|---|---|---|---|
| AB | 66 | 84 | 77 | 100 | 104 |
| BC | 46 | 57 | 64 | 58 | 58 |
| MB | 5 | 9 | 12 | 23 | 20 |
| NB | 12 | 7 | 7 | 6 | 4 |
| NL | 3 | 8 | 5 | 4 | 13 |
| NS | 3 | 5 | 5 | 7 | 9 |
| ON | 106 | 134 | 186 | 221 | 349 |
| PE | 0 | ||||
| QC | 110 | 133 | 167 | 214 | 288 |
| SK | 11 | 26 | 21 | 9 | 16 |
| TOTAL | 362 | 463 | 544 | 642 | 861 |
| Discipline | AB | BC | MB | NB | NL | NS | ON | QC | SK | Total |
|---|---|---|---|---|---|---|---|---|---|---|
| Biosystems | 18 | 46 | 5 | 6 | 100 | 82 | 13 | 270 | ||
| Chemical | 113 | 21 | 14 | 261 | 51 | 8 | 468 | |||
| Civil | 86 | 92 | 28 | 9 | 3 | 14 | 444 | 364 | 14 | 1,054 |
| Computer | 8 | 2 | 7 | 85 | 50 | 13 | 165 | |||
| Electrical | 49 | 98 | 23 | 13 | 6 | 9 | 1,079 | 502 | 22 | 1,801 |
| Engineering Physics | 7 | 23 | 6 | 18 | 18 | 72 | ||||
| Environmental | 1 | 7 | 5 | 73 | 44 | 12 | 142 | |||
| Geological | 11 | 7 | 18 | |||||||
| Industrial or Manufacturing | 2 | 7 | 64 | 131 | 14 | 218 | ||||
| Materials or Metallurgical | 13 | 10 | 2 | 45 | 26 | 96 | ||||
| Mechanical | 82 | 72 | 20 | 10 | 3 | 16 | 824 | 256 | 13 | 1,296 |
| Mining or Mineral | 11 | 22 | 1 | 22 | 14 | 70 | ||||
| Software | 9 | 141 | 7 | 157 | ||||||
| Other | 23 | 11 | 22 | 103 | 463 | 375 | 20 | 1,017 | ||
| TOTAL | 410 | 377 | 78 | 64 | 48 | 183 | 3,494 | 2,054 | 136 | 6,844 |
| Discipline | AB | BC | MB | NB | NL | NS | ON | QC | SK | Total |
|---|---|---|---|---|---|---|---|---|---|---|
| Biosystems | 9 | 12 | 1 | 3 | 43 | 30 | 4 | 102 | ||
| Chemical | 34 | 2 | 1 | 122 | 55 | 5 | 219 | |||
| Civil | 35 | 15 | 5 | 1 | 4 | 3 | 117 | 50 | 4 | 234 |
| Computer | 8 | 4 | 7 | 14 | 1 | 34 | ||||
| Electrical | 37 | 38 | 19 | 2 | 3 | 8 | 237 | 95 | 1 | 440 |
| Engineering Physics | 6 | 6 | 2 | 5 | 11 | 30 | ||||
| Environmental | 13 | 5 | 6 | 24 | ||||||
| Geological | 2 | 2 | ||||||||
| Industrial or Manufacturing | 15 | 2 | 2 | 20 | 1 | 40 | ||||
| Materials or Metallurgical | 13 | 7 | 2 | 16 | 33 | 71 | ||||
| Mechanical | 23 | 37 | 1 | 2 | 3 | 190 | 93 | 3 | 352 | |
| Mining or Mineral | 5 | 5 | 5 | 1 | 16 | |||||
| Software | 2 | 1 | 3 | |||||||
| Other | 18 | 5 | 6 | 37 | 76 | 4 | 146 | |||
| TOTAL | 188 | 122 | 41 | 12 | 17 | 24 | 796 | 484 | 29 | 1,713 |
| Institution | 2013 | 2014 | 2015 | 2016 | 2017 |
|---|---|---|---|---|---|
| Acadia | 0 | ||||
| Alberta | 281 | 279 | 239 | 198 | 207 |
| BCIT | 0 | 0 | 0 | 0 | 0 |
| Calgary | 179 | 215 | 194 | 209 | 203 |
| Carleton | 193 | 230 | 251 | 258 | 236 |
| Concordia | 572 | 626 | 667 | 783 | 782 |
| Conestoga | 0 | 0 | 0 | 0 | 0 |
| Dal | 173 | 205 | 341 | 131 | 178 |
| ETS | 259 | 293 | 385 | 391 | 367 |
| Guelph | 44 | 44 | 46 | 50 | 47 |
| Lakehead | 16 | 0 | 8 | 18 | |
| Laurentian | 61 | 0 | 11 | 8 | 10 |
| Laval | 70 | 70 | 60 | 86 | 63 |
| Manitoba | 62 | 74 | 89 | 76 | 78 |
| McGill | 157 | 124 | 153 | 160 | 232 |
| McMaster | 255 | 230 | 250 | 218 | 225 |
| Moncton | 2 | 4 | 0 | 5 | 3 |
| MUN | 103 | 120 | 131 | 134 | 48 |
| NSAC | 11 | 0 | 0 | ||
| Ottawa | 241 | 465 | 414 | 532 | 426 |
| Polytechnique | 281 | 334 | 222 | 304 | 360 |
| Queen's | 113 | 106 | 118 | 151 | 136 |
| Regina | 60 | 76 | 83 | 80 | 66 |
| RMC | 22 | 19 | 16 | 24 | 4 |
| Ryerson | 295 | 189 | 176 | 162 | 221 |
| Saskatchewan | 59 | 64 | 61 | 60 | 70 |
| SFU | 38 | 28 | 31 | 31 | 34 |
| Sherbrooke | 65 | 90 | 91 | 79 | 139 |
| SMU | 1 | 2 | 5 | ||
| Toronto | 496 | 540 | 631 | 669 | 676 |
| UBC | 251 | 237 | 237 | 248 | 246 |
| UBCO | 20 | 24 | 37 | 41 | 33 |
| UNB | 48 | 63 | 24 | 49 | 61 |
| UNBC | 0 | 0 | 0 | 0 | 0 |
| UOIT | 30 | 36 | 39 | 79 | 61 |
| UPEI | 0 | ||||
| UQAC | 8 | 12 | 8 | 33 | 63 |
| UQAM | 0 | 5 | |||
| UQAR | 8 | 2 | 5 | 8 | 12 |
| UQAT | 19 | 10 | 5 | 0 | 12 |
| UQO | 0 | 0 | 0 | 0 | |
| UQTR | 98 | 78 | 93 | 41 | 24 |
| UVic | 31 | 28 | 40 | 60 | 64 |
| Waterloo | 502 | 486 | 480 | 416 | 450 |
| Western | 131 | 187 | 217 | 286 | 457 |
| Windsor | 253 | 373 | 396 | 451 | 526 |
| York | 0 | 4 | 8 | 19 | |
| TOTAL | 5,496 | 5,978 | 6,253 | 6,539 | 6,844 |
| Institution | 2013 | 2014 | 2015 | 2016 | 2017 |
|---|---|---|---|---|---|
| Acadia | 0 | ||||
| Alberta | 111 | 126 | 83 | 120 | 117 |
| BCIT | 0 | 0 | 0 | 0 | 0 |
| Calgary | 92 | 95 | 70 | 85 | 71 |
| Carleton | 36 | 30 | 36 | 41 | 42 |
| Concordia | 60 | 53 | 56 | 74 | 54 |
| Conestoga | 0 | 0 | 0 | 0 | 0 |
| Dal | 16 | 13 | 19 | 26 | 24 |
| ETS | 35 | 44 | 58 | 62 | 56 |
| Guelph | 9 | 7 | 12 | 10 | 12 |
| Lakehead | 0 | 0 | 0 | 0 | |
| Laurentian | 31 | 0 | 3 | 4 | 5 |
| Laval | 33 | 33 | 40 | 35 | 53 |
| Manitoba | 28 | 29 | 27 | 52 | 41 |
| McGill | 100 | 120 | 106 | 94 | 113 |
| McMaster | 40 | 36 | 65 | 69 | 79 |
| Moncton | 0 | 0 | 0 | 0 | 0 |
| MUN | 12 | 14 | 19 | 16 | 17 |
| NSAC | 5 | 0 | 0 | ||
| Ottawa | 21 | 39 | 25 | 44 | 62 |
| Polytechnique | 88 | 117 | 95 | 107 | 122 |
| Queen's | 46 | 36 | 48 | 40 | 36 |
| Regina | 7 | 17 | 10 | 13 | 10 |
| RMC | 4 | 6 | 3 | 7 | 5 |
| Ryerson | 42 | 39 | 44 | 43 | 46 |
| Saskatchewan | 14 | 18 | 26 | 17 | 19 |
| SFU | 12 | 12 | 24 | 23 | 14 |
| Sherbrooke | 27 | 42 | 48 | 36 | 56 |
| SMU | 0 | 0 | 0 | ||
| Toronto | 106 | 110 | 152 | 150 | 178 |
| UBC | 93 | 67 | 50 | 42 | 57 |
| UBCO | 7 | 7 | 15 | 17 | 21 |
| UNB | 18 | 16 | 11 | 11 | 12 |
| UNBC | 0 | 0 | 0 | 0 | 0 |
| UOIT | 10 | 16 | 14 | 13 | 16 |
| UPEI | 0 | ||||
| UQAC | 5 | 9 | 14 | 19 | 16 |
| UQAM | 0 | 0 | |||
| UQAR | 0 | 0 | 0 | 0 | 0 |
| UQAT | 0 | 0 | 0 | 0 | 0 |
| UQO | 0 | 0 | 0 | 0 | |
| UQTR | 6 | 7 | 8 | 11 | 14 |
| UVic | 14 | 25 | 27 | 35 | 30 |
| Waterloo | 134 | 125 | 150 | 144 | 127 |
| Western | 53 | 50 | 40 | 63 | 168 |
| Windsor | 20 | 26 | 23 | 23 | 20 |
| York | 0 | 0 | 0 | 0 | |
| TOTAL | 1,330 | 1,389 | 1,421 | 1,546 | 1,713 |
| Institution | 2013 | 2014 | 2015 | 2016 | 2017 |
|---|---|---|---|---|---|
| Acadia | 0 | ||||
| Alberta | 63 | 81 | 66 | 69 | 55 |
| BCIT | 0 | 0 | 0 | 0 | 0 |
| Calgary | 43 | 64 | 50 | 70 | 67 |
| Carleton | 31 | 51 | 56 | 64 | 50 |
| Concordia | 129 | 124 | 179 | 167 | 186 |
| Conestoga | 0 | 0 | 0 | 0 | 0 |
| Dal | 27 | 19 | 40 | 28 | 45 |
| ETS | 39 | 54 | 85 | 89 | 99 |
| Guelph | 11 | 11 | 16 | 16 | 18 |
| Lakehead | 2 | 0 | 1 | 3 | |
| Laurentian | 8 | 0 | 1 | 2 | 2 |
| Laval | 20 | 20 | 17 | 28 | 15 |
| Manitoba | 14 | 14 | 21 | 21 | 20 |
| McGill | 53 | 31 | 32 | 36 | 74 |
| McMaster | 67 | 90 | 72 | 56 | 58 |
| Moncton | 0 | 0 | 0 | 1 | 0 |
| MUN | 28 | 28 | 34 | 36 | 7 |
| NSAC | 7 | 0 | 0 | ||
| Ottawa | 57 | 125 | 123 | 147 | 110 |
| Polytechnique | 74 | 87 | 68 | 63 | 103 |
| Queen's | 32 | 30 | 26 | 39 | 36 |
| Regina | 13 | 26 | 26 | 20 | 14 |
| RMC | 4 | 2 | 1 | 4 | 0 |
| Ryerson | 39 | 40 | 41 | 34 | 49 |
| Saskatchewan | 21 | 20 | 16 | 18 | 21 |
| SFU | 8 | 5 | 6 | 8 | 10 |
| Sherbrooke | 12 | 10 | 12 | 14 | 26 |
| SMU | 0 | 0 | 0 | ||
| Toronto | 125 | 146 | 164 | 210 | 173 |
| UBC | 62 | 60 | 49 | 57 | 67 |
| UBCO | 11 | 6 | 6 | 6 | 4 |
| UNB | 12 | 17 | 5 | 8 | 19 |
| UNBC | 0 | 0 | 0 | 0 | 0 |
| UOIT | 5 | 5 | 9 | 19 | 10 |
| UPEI | 0 | ||||
| UQAC | 0 | 4 | 1 | 6 | 12 |
| UQAM | 0 | 0 | |||
| UQAR | 0 | 0 | 0 | 1 | 2 |
| UQAT | 3 | 0 | 0 | 0 | 1 |
| UQO | 0 | 0 | 0 | 0 | |
| UQTR | 59 | 40 | 57 | 19 | 6 |
| UVic | 6 | 4 | 9 | 8 | 15 |
| Waterloo | 123 | 112 | 129 | 98 | 141 |
| Western | 30 | 53 | 64 | 111 | 144 |
| Windsor | 44 | 67 | 50 | 88 | 76 |
| York | 0 | 2 | 1 | 5 | |
| TOTAL | 1,275 | 1,453 | 1,534 | 1,665 | 1,740 |
| Institution | 2013 | 2014 | 2015 | 2016 | 2017 |
|---|---|---|---|---|---|
| Acadia | 0 | ||||
| Alberta | 16 | 22 | 22 | 30 | 25 |
| BCIT | 0 | 0 | 0 | 0 | 0 |
| Calgary | 15 | 22 | 13 | 16 | 16 |
| Carleton | 3 | 1 | 6 | 13 | 7 |
| Concordia | 9 | 12 | 8 | 17 | 9 |
| Conestoga | 0 | 0 | 0 | 0 | 0 |
| Dal | 5 | 4 | 4 | 12 | 3 |
| ETS | 3 | 7 | 12 | 19 | 16 |
| Guelph | 1 | 1 | 1 | 4 | 2 |
| Lakehead | 0 | 0 | 0 | 0 | |
| Laurentian | 3 | 0 | 1 | 0 | 2 |
| Laval | 0 | 0 | 9 | 6 | 13 |
| Manitoba | 4 | 6 | 3 | 6 | 11 |
| McGill | 14 | 30 | 26 | 17 | 30 |
| McMaster | 9 | 8 | 13 | 11 | 20 |
| Moncton | 0 | 0 | 0 | 0 | 0 |
| MUN | 2 | 3 | 0 | 3 | 4 |
| NSAC | 0 | 0 | 0 | ||
| Ottawa | 4 | 5 | 3 | 11 | 18 |
| Polytechnique | 20 | 32 | 25 | 32 | 39 |
| Queen's | 6 | 6 | 11 | 12 | 3 |
| Regina | 3 | 5 | 3 | 3 | 2 |
| RMC | 0 | 2 | 2 | 2 | 1 |
| Ryerson | 8 | 9 | 11 | 6 | 9 |
| Saskatchewan | 4 | 4 | 3 | 4 | 10 |
| SFU | 0 | 4 | 5 | 5 | 4 |
| Sherbrooke | 3 | 7 | 14 | 9 | 8 |
| SMU | 0 | 0 | 0 | ||
| Toronto | 20 | 23 | 45 | 38 | 47 |
| UBC | 24 | 17 | 9 | 14 | 11 |
| UBCO | 1 | 0 | 2 | 1 | 2 |
| UNB | 3 | 4 | 3 | 4 | 5 |
| UNBC | 0 | 0 | 0 | 0 | 0 |
| UOIT | 0 | 5 | 2 | 2 | 3 |
| UPEI | 0 | ||||
| UQAC | 1 | 1 | 5 | 6 | 4 |
| UQAM | 0 | 0 | |||
| UQAR | 0 | 0 | 0 | 0 | 0 |
| UQAT | 0 | 0 | 0 | 0 | 0 |
| UQO | 0 | 0 | 0 | 0 | |
| UQTR | 1 | 1 | 1 | 6 | 2 |
| UVic | 2 | 4 | 4 | 4 | 4 |
| Waterloo | 22 | 26 | 37 | 30 | 25 |
| Western | 8 | 10 | 8 | 19 | 41 |
| Windsor | 6 | 7 | 3 | 4 | 5 |
| York | 0 | 0 | 0 | 0 | |
| TOTAL | 220 | 288 | 314 | 366 | 401 |
| Institution |
Biosystems
|
Chemical
|
Civil
|
Computer
|
Electrical
|
Engineering Physics
|
Environmental
|
Geological
|
Industrial or Manufacturing
|
Materials or Metallurgical
|
Mechanical
|
Mining or Mineral
|
Software
|
Other
|
|---|---|---|---|---|---|---|---|---|---|---|---|---|---|---|
| Alberta | 36 | 62 | 8 | 19 | 7 | 13 | 36 | 11 | 15 | |||||
| BCIT | ||||||||||||||
| Calgary | 18 | 77 | 24 | 30 | 46 | 8 | ||||||||
| Carleton | 5 | 36 | 4 | 101 | 12 | 2 | 23 | 53 | ||||||
| Concordia | 178 | 310 | 39 | 111 | 117 | 27 | ||||||||
| Conestoga | ||||||||||||||
| Dal | 6 | 14 | 14 | 9 | 1 | 5 | 7 | 2 | 16 | 1 | 103 | |||
| ETS | 40 | 36 | 29 | 15 | 33 | 24 | 190 | |||||||
| Guelph | 6 | 8 | 27 | 6 | ||||||||||
| Laurentian | 10 | |||||||||||||
| Laval | 4 | 2 | 19 | 13 | 7 | 6 | 11 | 1 | ||||||
| Manitoba | 5 | 28 | 23 | 2 | 20 | |||||||||
| McGill | 63 | 22 | 36 | 47 | 17 | 36 | 11 | |||||||
| McMaster | 11 | 12 | 13 | 15 | 35 | 11 | 2 | 9 | 25 | 9 | 83 | |||
| Moncton | 3 | |||||||||||||
| MUN | 3 | 7 | 6 | 7 | 3 | 22 | ||||||||
| Ottawa | 8 | 37 | 35 | 147 | 24 | 61 | 114 | |||||||
| Polytechnique | 15 | 21 | 54 | 50 | 54 | 18 | 70 | 3 | 33 | 13 | 29 | |||
| Queen's | 18 | 17 | 34 | 7 | 7 | 41 | 12 | |||||||
| Regina | 13 | 12 | 14 | 7 | 20 | |||||||||
| RMC | 2 | 1 | 1 | |||||||||||
| Ryerson | 4 | 9 | 48 | 50 | 53 | 30 | 27 | |||||||
| Saskatchewan | 13 | 8 | 14 | 22 | 13 | |||||||||
| SFU | 22 | 12 | ||||||||||||
| Sherbrooke | 3 | 37 | 31 | 29 | 39 | |||||||||
| SMU | 5 | |||||||||||||
| Toronto | 38 | 66 | 99 | 178 | 27 | 219 | 49 | |||||||
| UBC | 46 | 84 | 43 | 1 | 1 | 11 | 10 | 28 | 22 | |||||
| UBCO | 8 | 16 | 9 | |||||||||||
| UNB | 21 | 9 | 13 | 10 | 8 | |||||||||
| UNBC | ||||||||||||||
| UOIT | 13 | 26 | 22 | |||||||||||
| UPEI | ||||||||||||||
| UQAC | 8 | 55 | ||||||||||||
| UQAR | 12 | |||||||||||||
| UQAT | 12 | |||||||||||||
| UQTR | 3 | 11 | 7 | 3 | ||||||||||
| UVic | 2 | 39 | 23 | |||||||||||
| Waterloo | 52 | 49 | 166 | 69 | 114 | |||||||||
| Western | 28 | 65 | 98 | 166 | 100 | |||||||||
| Windsor | 44 | 186 | 10 | 62 | 7 | 217 | ||||||||
| York | 4 | 8 | 7 | |||||||||||
| TOTAL | 270 | 468 | 1,054 | 165 | 1,801 | 72 | 142 | 18 | 218 | 96 | 1,296 | 70 | 157 | 1,017 |
| Institution |
Biosystems
|
Chemical
|
Civil
|
Computer
|
Electrical
|
Engineering Physics
|
Environmental
|
Geological
|
Industrial or Manufacturing
|
Materials or Metallurgical
|
Mechanical
|
Mining or Mineral
|
Software
|
Other
|
|---|---|---|---|---|---|---|---|---|---|---|---|---|---|---|
| Alberta | 16 | 28 | 8 | 21 | 6 | 13 | 11 | 5 | 9 | |||||
| BCIT | ||||||||||||||
| Calgary | 9 | 18 | 7 | 16 | 12 | 9 | ||||||||
| Carleton | 6 | 29 | 3 | 3 | 1 | |||||||||
| Concordia | 11 | 17 | 6 | 16 | 1 | 3 | ||||||||
| Conestoga | ||||||||||||||
| Dal | 3 | 1 | 3 | 8 | 2 | 2 | 2 | 3 | ||||||
| ETS | 56 | |||||||||||||
| Guelph | 5 | 1 | 5 | 1 | ||||||||||
| Laurentian | 5 | |||||||||||||
| Laval | 9 | 6 | 7 | 2 | 12 | 17 | ||||||||
| Manitoba | 1 | 5 | 19 | 15 | 1 | |||||||||
| McGill | 15 | 8 | 13 | 39 | 19 | 19 | ||||||||
| McMaster | 6 | 17 | 7 | 6 | 17 | 5 | 7 | 12 | 2 | |||||
| Moncton | ||||||||||||||
| MUN | 4 | 4 | 3 | 6 | ||||||||||
| Ottawa | 7 | 14 | 29 | 3 | 9 | |||||||||
| Polytechnique | 15 | 19 | 8 | 14 | 16 | 11 | 11 | 2 | 21 | 1 | 4 | |||
| Queen's | 9 | 7 | 12 | 8 | ||||||||||
| Regina | 1 | 4 | 1 | 4 | ||||||||||
| RMC | 2 | 2 | 1 | |||||||||||
| Ryerson | 3 | 5 | 15 | 18 | 5 | |||||||||
| Saskatchewan | 4 | 5 | 4 | 1 | 2 | 3 | ||||||||
| SFU | 6 | 8 | ||||||||||||
| Sherbrooke | 13 | 12 | 11 | 20 | ||||||||||
| SMU | ||||||||||||||
| Toronto | 20 | 22 | 28 | 58 | 6 | 35 | 9 | |||||||
| UBC | 12 | 5 | 18 | 2 | 7 | 8 | 5 | |||||||
| UBCO | 10 | 3 | 8 | |||||||||||
| UNB | 2 | 1 | 2 | 2 | 5 | |||||||||
| UNBC | ||||||||||||||
| UOIT | 7 | 6 | 3 | |||||||||||
| UPEI | ||||||||||||||
| UQAC | 3 | 13 | ||||||||||||
| UQAR | ||||||||||||||
| UQAT | ||||||||||||||
| UQTR | 6 | 5 | 3 | |||||||||||
| UVic | 17 | 13 | ||||||||||||
| Waterloo | 25 | 25 | 33 | 25 | 19 | |||||||||
| Western | 12 | 37 | 22 | 30 | 67 | |||||||||
| Windsor | 3 | 5 | 2 | 2 | 3 | 5 | ||||||||
| York | ||||||||||||||
| TOTAL | 102 | 219 | 234 | 34 | 440 | 30 | 24 | 2 | 40 | 71 | 352 | 16 | 3 | 146 |
Faculty Members by institution (F)
| Institution |
Male Professors
|
Female Professors
|
Male Associate Professors
|
Female Associate Professors
|
Male Assistant Professors
|
Female Assistant Professors
|
Male Instructors/Lecturers
|
Female Instructors/Lecturers
|
Total Full Time Equivalent
|
|
|---|---|---|---|---|---|---|---|---|---|---|
| Alberta | 108 | 8 | 37 | 9 | 38 | 9 | 4.3 | 13.8 | 227.1 | |
| BCIT | 47 | 7.25 | 0 | 0 | 0 | 0 | 0 | 0 | 54.25 | |
| Calgary | 77 | 10 | 30 | 8 | 23 | 11 | ||||
| Cape Breton | 2 | 4 | 1 | |||||||
| Carleton | 55 | 5 | 58 | 12.5 | 23 | 4 | 4 | 1 | 162.5 | |
| Concordia | 83.5 | 11 | 41 | 17 | 29 | 4 | 19 | 5 | 209.5 | |
| Conestoga | 12 | 2 | 0 | 0 | 0 | 0 | 5.5 | 0 | 19.5 | |
| Dal | 43.33 | 5.33 | 20.5 | 6 | 6 | 3 | 15.5 | 4.4 | 104.06 | |
| ETS | 70 | 12 | 98.5 | 17 | 14 | 6 | 163 | 30 | 410.5 | |
| Guelph | 14 | 3 | 15.21 | 4 | 8.33 | 3 | 0 | 0 | 47.54 | |
| Laurentian | 7.5 | 1 | 8.5 | 2 | 2 | 1 | ||||
| Manitoba | 35.5 | 3 | 15 | 5 | 12.09 | 4.17 | 5.94 | 4.22 | 84.92 | |
| McGill | 48 | 6 | 53 | 7 | 13 | 6 | 7.7 | 1.8 | 142.5 | |
| McMaster | 81.75 | 5 | 26.9 | 8 | 14 | 9 | 9 | 2 | 155.65 | |
| Moncton | 13 | 0 | 3 | 2 | 4 | 1 | 0 | 0 | 23 | |
| MUN | 25 | 3 | 19.49 | 5 | 18.6 | 1.6 | 5 | 3 | 80.69 | |
| NSAC | 2 | 0 | 6 | 1 | 1 | 0 | 4.67 | 0.67 | 15.34 | |
| Ottawa | 53 | 10 | 25 | 10 | 15 | 4 | 7 | 1 | 125 | |
| Polytechnique | 125 | 18 | 46 | 8 | 31 | 4 | 17 | 5 | 254 | |
| Queen's | 60.2 | 11.5 | 37 | 0.4 | 8 | 3.8 | 6.2 | 0 | 127.1 | |
| Regina | 19 | 3 | 7 | 1 | 4 | 2 | 16 | 1 | 53 | |
| RMC | 24 | 1 | 21 | 2.5 | 4.5 | 1.5 | 19 | 0 | 73.5 | |
| Ryerson | 77 | 9 | 29 | 5 | 8 | 4 | 1 | 0 | 133 | |
| Saskatchewan | 41 | 3 | 22 | 14.05 | 4 | 1 | 2 | |||
| SFU | 22.5 | 3 | 5 | 3 | 2 | 1 | 8 | 2 | 46.5 | |
| Sherbrooke | 63 | 5 | 20 | 2 | 10 | 1 | 25.9 | 3.3 | 130.2 | |
| SMU | 0 | 0 | 1 | 0 | 5 | 0 | 0 | 0 | 6 | |
| Toronto | 127.47 | 21 | 42 | 14 | 17 | 12 | 18 | 9 | 260.47 | |
| UBC | 95 | 16 | 21 | 3 | 16 | 9 | 25.35 | 9.34 | 194.69 | |
| UBCO | 9 | 2 | 12 | 2 | 13 | 1 | 7 | 5 | 51 | |
| UNB | 35.33 | 5 | 12 | 0.5 | 6 | 1 | 5 | 0 | 64.83 | |
| UNBC | 3.3 | 1 | ||||||||
| UOIT | 19 | 0.75 | 18 | 4.5 | 10 | 1 | 10 | 0 | 63.25 | |
| UPEI | 1 | 0 | 4 | 1 | 6 | 1.5 | ||||
| UQAC | 14 | 3 | 10 | 2 | 0 | 1 | 16.5 | 2 | 48.5 | |
| UQAR | 10 | 0 | 0 | 0 | 0 | 0 | ||||
| UQAT | 7 | 0 | 3 | 1 | 1 | 1 | ||||
| UQO | 11 | 1 | 3 | 3 | 2 | 0 | ||||
| UQTR | 19 | 1 | 9 | 1 | 1 | |||||
| UVic | 33 | 6 | 18 | 3 | 7 | 2 | 1 | 0 | 70 | |
| Waterloo | 116.78 | 17 | 73.99 | 14.51 | 29 | 10 | 26 | 8.5 | 295.78 | |
| Western | 49 | 5 | 25 | 6 | 9 | 5 | 9 | 0 | 108 | |
| Windsor | 41.6 | 3 | 15.5 | 4 | 4 | 3 | 5 | 2 | 78.1 | |
| York | 14.5 | 2 | 21 | 3 | 25 | 2 | 3 | 0 | 70.5 | |
| TOTAL | 1,815.26 | 227.83 | 933.59 | 193.91 | 453.57 | 135.57 | 478.56 | 119.03 | 3,990.47 |
Co-op, Internship, and Professional Experience Programs (C)
| Institution | Type of Program | Mandatory/Optional |
|---|---|---|
| Alberta | Co-op | Optional |
| Calgary | Internship | Optional |
| Cape Breton | Co-op | Optional |
| Carleton | Co-op | Optional |
| Concordia | Co-op & Internship | Optional |
| Conestoga | Co-op | Mandatory |
| ETS | Co-op | Mandatory |
| Guelph | Co-op | Mandatory |
| Laurentian | Co-op & Internship | Optional |
| Manitoba | Co-op | Optional |
| McGill | Co-op & Internship | Varies |
| McMaster | Co-op | Optional |
| Moncton | Co-op | Optional |
| MUN | Co-op | Mandatory |
| Ottawa | Co-op | Varies |
| Queen's | Internship | Optional |
| Ryerson | Co-op & Internship | Varies |
| Saskatchewan | Internship | Optional |
| SFU | Co-op | Varies |
| Sherbrooke | Co-op | Optional |
| Toronto | Internship | Optional |
| UBC | Co-op | Optional |
| UBCO | Co-op | Optional |
| UNB | Co-op | Optional |
| UNBC | Co-op | Optional |
| UQAC | Internship | Optional |
| UQAR | Co-op | Optional |
| UQAT | Co-op | Optional |
| UQTR | Internship | Mandatory |
| UVic | Co-op | Mandatory |
| Waterloo | Co-op | Mandatory |
| Western | Co-op & Internship | Optional |
| Windsor | Co-op | Optional |
| York | Co-op | Optional |
Appendix B
Accredited engineering programs by institution
- This listing of accredited programs includes only engineering programs that lead to a bachelor’s degree.
- Institutions listed have voluntarily requested that specific engineering programs be evaluated by the Accreditation Board. The terminology requested by the institution is shown.
- A single date which follows the name of a program indicates the year of the first graduating class for which accreditation applies. Accreditation applies to subsequent years and is still enforced.
- A double date following the name of a program indicates the period (inclusive of both years) for which the program was accredited. This may occur if the institution has discontinued the program under that specific name or has not requested renewal of accreditation or if the Accreditation Board has denied such renewal.
- The appearance of a third date indicates that accreditation has been renewed from that particular year on, after a time interval.
ACADIA, UNIVERSITY
Wolfville, Nova Scotia
Ivan Curry School of Engineering
- Year One – Common 1980-
ALBERTA, UNIVERSITY OF
Edmonton, Alberta
Faculty of Engineering
- Agricultural Engineering 1983-1995
- Chemical Engineering 1965-
- Civil Engineering 1965-
- Computer Engineering 1983-
- Electrical Engineering 1965-
- Engineering Physics 1988-
- Materials Engineering 1999-
- Mechanical Engineering 1965-
- Metallurgical Engineering 1965-2000
- Mineral Engineering 1976-1982
- Mineral Process Engineering 1983-1991
- Mining Engineering 1965-1975, 1983-
- Petroleum Engineering 1978-
- Year One – Common 1980-
BRITISH COLUMBIA INSTITUE OF TECHNOLOGY
Burnaby, British Columbia
- Civil Engineering 2010-
- Electrical Engineering 2011-
- Mechanical Engineering 2014-
BRITISH COLUMBIA, THE UNIVERSITY OF
Vancouver, British Columbia
Faculty of Applied Science
- Agricultural Engineering 1965-1978
- Bio-Resource Engineering 1979-2001
- Chemical and Biological Engineering 2003-
- Chemical Engineering 1965-
- Civil Engineering 1965-
- Computer Engineering 2000-
- Electrical Engineering 1965-
- Engineering Physics 1965-
- Environmental Engineering 2007-
- Geological Engineering 1965-
- Integrated Engineering 2003-
- Materials Engineering 2006-
- Mechanical Engineering 1965-
- Metallurgical Engineering 1965-1987
- Metals and Materials Engineering 1988-2005
- Mineral Engineering 1965-1979
- Mining and Mineral Process Engineering 1980-2005
- Mining Engineering 2004-
- Year One – Common 1980-
BRITISH COLUMBIA-OKANAGAN, THE UNIVERSITY OF
Kelowna, British Columbia
Faculty of Applied Science
- Civil Engineering 2010-
- Electrical Engineering 2010-
- Mechanical Engineering 2010-
- Year One – Common 2010-
CALGARY, THE UNIVERSITY OF
Calgary, Alberta
Schulich School of Engineering
- Chemical Engineering 1969-
- Civil Engineering 1969-
- Computer Engineering 2002-2016
- Electrical Engineering 1969-
- Energy Engineering 2017-
- Geomatics Engineering 1996-
- Manufacturing Engineering 1997-
- Mechanical Engineering 1969-
- Oil and Gas Engineering 2001-
- Software Engineering 2002-
- Surveying Engineering 1982-1997
- Year One – Common 1980-
CAPE BRETON, UNIVERSITY COLLEGE OF
Sydney, Nova Scotia
- Year One – Common 1980-
CARLETON UNIVERSITY
Ottawa, Ontario
Faculty of Engineering and Design
- Aerospace Engineering 1992-
- Architectural Conservation and Sustainability 2015-
- Biomedical and Electrical 2010-
- Biomedical and Mechanical 2012-
- Civil Engineering 1965-
- Communications Engineering 2002-
- Computer Systems Engineering 1984-
- Electrical Engineering 1965-
- Engineering Physics 2003-
- Environmental Engineering 1996-
- Mechanical Engineering 1965-
- Software Engineering 2003-
- Sustainable & Renewable Energy 2012-
- Year One - Common 1998-
CONCORDIA UNIVERSITY
Montréal, Québec
(formerly Sir George Williams University, 1959-1974)
Faculty of Engineering and Computer Science
- Building Engineering 1982-
- Civil Engineering 1969-
- Computer Engineering 1983-
- Electrical Engineering 1969-
- Industrial Engineering 1995-
- Mechanical Engineering 1969-
- Software Engineering 2002-
CONESTOGA COLLEGE
Kitchener, Ontario
School of Engineering and Information Technology
- Electronic Systems Engineering 2014-
- Mechanical Systems Engineering 2010-
DALHOUSIE UNIVERSITY
Halifax, Nova Scotia
(formerly Dal Tech, 1997-2000 and Technical University of Nova Scotia, 1981-1997
and Nova Scotia Technical College, 1907-1980)
Faculty of Engineering
- Agricultural Engineering 1974-2000
- Biological Engineering 1997-
- Chemical Engineering 1965-
- Civil Engineering 1965-
- Computer Engineering 2006-
- Core Program 1980-
- Electrical Engineering 1965-
- Engineering Physics 1987-1991
- Environmental Engineering 2006-
- Industrial Engineering 1969-
- Materials Engineering 2005-
- Mechanical Engineering 1965-
- Metallurgical Engineering 1965-1977, 1981-2005
- Mineral Resources Engineering 2007-
- Mining Engineering 1965-2006
ÉCOLE DE TECHNOLOGIE SUPÉRIEURE
Montréal, Québec
(affiliated with l’Université du Québec)
- Génie de la construction 1993-
- Génie de la production automatisée 1990-
- Génie des opérations et de la logistique 2008-
- Génie des technologies de l'information 2006-
- Génie électrique 1990-
- Génie et gestion de la construction 1990-1996
- Génie logiciel 2004-
- Génie mécanique 1990-
GUELPH, UNIVERSITY OF
Guelph, Ontario
School of Engineering
- Agricultural Engineering 1973-1995
- Biological Engineering 1973-
- Biomedical Engineering 2014-
- Computer Engineering 2014-
- Engineering Systems and Computing 1994-
- Environmental Engineering 1993-
- Food Engineering 1993-2000
- Mechanical Engineering 2013-
- Water Resources Engineering 1973-
- Year One – Common 1997-
LAKEHEAD UNIVERSITY
Thunder Bay, Ontario
Faculty of Engineering
- Chemical Engineering 1974-
- Civil Engineering 1974-
- Electrical Engineering 1974-
- Mechanical Engineering 1974-
- Software Engineering 2002-
- Year One – Common 1998-
LAURENTIAN UNIVERSITY
Sudbury, Ontario
School of Engineering
- Chemical Engineering 2006-
- Extractive Metallurgical Engineering 1987-2006
- Extractive Metallurgy 1985-1986
- Mechanical Engineering 2011-
- Mineral Resources Engineering 1987-
- Mining Engineering 1987-
- Year One – Common 1980-
LAVAL, UNIVERSITÉ
Québec, Québec
Faculty of Science and Engineering
- Génie agroalimentaire 1999-
- Génie agroenvironnemental 2002-
- Génie alimentaire 1997-
- Génie chimique 1965-
- Génie civil 1965-
- Génie des eaux 2009-
- Génie des matériaux et de la métallurgie 1990-
- Génie des mines et de la minéralurgie 1990-
- Génie du bois 2002-
- Génie électrique 1965-
- Génie géologique 1965-
- Génie géomatique 2007-
- Génie industriel 2014-
- Génie informatique 1993-
- Génie logiciel 2006-
- Génie mécanique 1965-
- Génie métallurgique 1965-1990
- Génie minier 1965-1990
- Génie physique 1965-
- Génie rural 1973-2002
- Ingénierie Réhabilitation:Infrastructure Urbaines 1999-
- Première année- Tronc commun 1980-
MANITOBA, THE UNIVERSITY OF
Winnipeg, Manitoba
Faculty of Engineering
- Agricultural Engineering 1971-1998
- Biosystems Engineering 1996-
- Civil Engineering 1965-
- Computer Engineering 1987-
- Electrical Engineering 1965-
- Geological Engineering 1965-2001
- Industrial Engineering 1987-2005
- Manufacturing Engineering 2003-2013
- Mechanical Engineering 1965-
- Year One – Common 1980-
MCGILL UNIVERSITY
Montréal, Québec
Faculty of Engineering
- Agricultural Engineering 1971-2006
- Chemical Engineering 1965-
- Civil Engineering 1965-
- Computer Engineering 1993-
- Electrical Engineering 1965-
- General Engineering 2000-
- Materials Engineering 2005-
- Mechanical Engineering 1965-
- Metallurgical Engineering 1965-2007
- Mining Engineering 1965-
- Software Engineering 2007-
MCMASTER UNIVERSITY
Hamilton, Ontario
Faculty of Engineering
- Ceramic Engineering 1974-1998
- Chemical Engineering 1965-
- Chemical Engineering and Bioengineering 2006-
- Civil Engineering 1989-
- Civil Engineering and Computer Systems 1992-1995
- Civil Engineering and Engineering Mechanics 1965-1988
- Computer Engineering 1981-
- Electrical & Biomedical Engineering 2006-
- Electrical Engineering 1965-
- Engineering Physics 1974-
- Manufacturing Engineering 1982-2005
- Materials Engineering 1990-
- Mechanical Engineering 1965-
- Mechatronics Engineering 2009-
- Metallurgical Engineering 1965-1997
- Software Engineering 2001-
- Year One – Common 1965-
MEMORIAL UNIVERSITY OF NEWFOUNDLAND
St. John’s, Newfoundland
Faculty of Engineering and Applied Science
- Civil Engineering 1975-
- Computer Engineering 2002-
- Electrical Engineering 1975-
- Mechanical Engineering 1975-
- Naval Architectural Engineering 1986-1996
- Ocean and Naval Architectural Engineering 1997-
- Process Engineering 2013-
- Shipbuilding Engineering 1982-1985
- Year One – Common 1980-
MONCTON, UNIVERSITÉ DE
Moncton, Nouveau-Brunswick
Faculté d’ingénierie
- Génie civil 1972-
- Génie électrique 1998-
- Génie industriel 1975-2009
- Génie mécanique 1990-
- Première année- Tronc commun 1980-
MOUNT ALLISON UNIVERSITY
Moncton, New Brunswick
Faculty of Science
- Year One – Common 1980-
NEW BRUNSWICK, UNIVERSITY OF
Fredericton, New Brunswick
Faculty of Computer Science and Faculty of Engineering
- Chemical Engineering 1965-
- Civil Engineering 1965-
- Computer Engineering 2001-
- Electrical Engineering 1965-
- Engineering Entrance 1980-
- Forest Engineering 1972-
- Geological Engineering 1984-
- Geomatics Engineering 1999-
- Mechanical Engineering 1965-
- Software Engineering 2006-
- Surveying Engineering 1972-1999
- Year One – Common 1980-
NORTHERN BRITISH COLUMBIA, UNIVERSITY OF
Prince George, British Columbia
College of Science and Management
- Environmental Engineering 2007-
NOVA SCOTIA AGRICULTURE COLLEGE
Truro, Nova Scotia
- Year One – Common 1980-
NOVA SCOTIA TECHNICAL COLLEGE
(See Dalhousie University. Nova Scotia Technical College offered accredited engineering programs 1907-1980)
NOVA SCOTIA, TECHNICAL UNIVERSITY OF
(See Dalhousie University.
?Technical University of Nova Scotia offered accredited engineering programs 1981-1997)
ONTARIO INSTITUTE OF TECHNOLOGY, UNIVERSITY OF
Oshawa, Ontario
Faculty of Engineering and Applied Science
- Automotive Engineering 2009-
- Electrical Engineering 2009-
- Manufacturing Engineering 2007-
- Mechanical Engineering 2008-
- Nuclear Engineering 2007-
- Software Engineering 2009-
OTTAWA, UNIVERSITY OF
Ottawa, Ontario
Faculty of Engineering
- Biomedical Mechanical Engineering 2009-
- Chemical Engineering 1965-
- Civil Engineering 1971-
- Computer Engineering 1990-
- Electrical Engineering 1965-
- Mechanical Engineering 1971-
- Software Engineering 2001-
PEI, UNIVERSITY OF
Charlottetown, Prince Edward Island
Faculty of Sustainable Design Engineering
- Science Engineering (Sustainable Design) 2017-
- Year One – Common 1985-
POLYTECHNIQUE, ÉCOLE
Montréal, Québec
(affiliated with l’Université de Montréal)
- Génie aérospatial 2012-
- Génie biomedical 2012-
- Génie chimique 1965-
- Génie civil 1965-
- Génie des matériaux 1990-2012
- Génie des mines 1991-
- Génie électrique 1965-
- Génie géologique 1965-
- Génie industriel 1973-
- Génie informatique 1989-
- Génie logiciel 2005-
- Génie mécanique 1965-
- Génie métallurgique 1965-1989
- Génie minier 1965-1991
- Génie physique 1965-
- Première année- Tronc commun 1980-
QUÉBEC À CHICOUTIMI, UNIVERSITÉ DU
Chicoutimi, Québec
Département des sciences appliquées
- Génie civil 2012-
- Génie électrique 2004-
- Génie géologique 1983-
- Génie informatique 1992-
- Génie mécanique 2004-
- Génie unifié 1981-2009
- Ingénierie de l'aluminium 2008-2012
QUÉBEC À MONTRÉAL, UNIVERSITÉ DU
Montréal, Québec
Faculté des sciences
- Génie microélectronique 2007-
QUÉBEC À RIMOUSKI, UNIVERSITÉ DU
Rimouski, Québec
Module de génie
- Génie des systèmes électromécaniques 1998-
- Génie électrique 2009-
- Génie mécanique 2009-
QUÉBEC À TROIS-RIVIÈRES, UNIVERSITÉ DU
Trois-Rivières, Québec
École d’ingénierie
- Génie chimique 1990-
- Génie électrique 1978-
- Génie industriel 1980-
- Génie mécanique 2000-
- Génie mécanique manufacturier 1987-1999
QUÉBEC EN ABITBI-TÉMISCAMINGUE, UNIVERSITÉ DU
Rouyn-Noranda, Québec
Unité d’enseignement et de recherche en sciences appliquées
- Génie électromécanique 2000-
- Génie mécanique 2010-
QUÉBEC EN OUTAOUAIS, UNIVERSITÉ DU
Gatineau, Québec
Module de l’ingénierie
- Génie informatique 2002-
QUEEN’S UNIVERSITY
Kingston, Ontario
Faculty of Applied Science
- Chemical Engineering 1965-
- Civil Engineering 1965-
- Computer Engineering 2002-
- Electrical Engineering 1965-
- Engineering Chemistry 1979-
- Engineering Physics 1965-
- Geological Engineering 1975-
- Materials and Metallurgical Engineering 1992-2002
- Mathematics and Engineering 1974-
- Mechanical Engineering 1965-
- Metallurgical Engineering 1965-1991
- Mining Engineering 1965-
- Year One – Common 1980-
REGINA, UNIVERSITY OF
Regina, Saskatchewan
Faculty of Engineering and Applied Science
- Electronic Information Systems Engineering 1986-1994
- Electronic Systems Engineering 1995-
- Environmental Systems Engineering 1997-
- Industrial Systems Engineering 1984-
- Petroleum Systems Engineering 2003-
- Regional Environmental Systems Engineering 1990-1997
- Regional Systems Engineering 1984-1989
- Software Systems Engineering 2007-
- Systems Engineering 1981-1983
- Year One – Common 1980-
ROYAL MILITARY COLLEGE OF CANADA
Kingston, Ontario
Faculty of Engineering
- Aeronautical Engineering 2009-
- Chemical and Materials Engineering 1992-2001
- Chemical Engineering 1965-1981, 2001-
- Civil Engineering 1965-
- Computer Engineering 1983-
- Electrical Engineering 1965-
- Engineering and Management 1972-1995
- Engineering Physics 1975-1995
- Fuels and Materials Engineering 1982-1991
- Mechanical Engineering 1965-
- Year One – Common 1980-
RYERSON POLYTECHNICAL INSTITUTE
(see Ryerson University)
RPI offered accredited engineering programs in 1992.
RYERSON POLYTECHNICAL UNIVERSITY (RPU)
(see Ryerson University)
RPU offered accredited engineering programs from 1992 to 2002.
RYERSON UNIVERSITY
Toronto, Ontario
Faculty of Engineering, Architecture and Science
- Aerospace Engineering 1992-
- Biomedical Engineering 2012-
- Chemical Engineering 1992-
- Civil Engineering 1992-
- Computer Engineering 2006-
- Electrical Engineering 1992-
- Industrial Engineering 1992-
- Mechanical Engineering 1992-
- Year One – Common 1992-
SAINT MARY'S UNIVERSITY
Halifax, Nova Scotia
Division of Engineering
- Engineering Science 1991-
- Year One – Common 1980-
SASKATCHEWAN, UNIVERSITY OF
Saskatoon, Saskatchewan
College of Engineering
- Agricultural and Bioresource Engineering 1992-
- Agricultural Engineering 1965-1992
- Chemical Engineering 1965-
- Civil Engineering 1965-
- Computer Engineering 2009-
- Electrical Engineering 1965-
- Engineering Physics 1965-
- Environmental Engineering 2011-
- Geological Engineering 1965-
- Geological Engineering (Geophysics) 1975-1999
- Mechanical Engineering 1965-
- Mining Engineering 1974-1976
- Year One – Common 1980-
SHERBROOKE, UNIVERSITÉ DE
Sherbrooke, Québec
Faculté de génie
- Génie biotechnologique 2008-
- Génie chimique 1973-
- Génie civil 1965-
- Génie du bâtiment 2017-
- Génie électrique 1965-
- Génie informatique 1997-
- Génie mécanique 1965-
- Génie robotique 2017-
SIMON FRASER UNIVERSITY
Sherbrooke, Québec
School of Engineering Science
- Engineering Science 1986-
- Mechatronic Systems Engineering 2011-
SIR GEORGE WILLIAMS UNIVERSITY (SGW)
Montreal, Quebec
(see Concordia University. SGW offered accredited engineering programs from 1969 to 1974.)
ST. FRANCIS XAVIER UNIVERSITY
Antigonish, Nova Scotia
- St. Francis Xavier University
- Year One - Common 1980-
TORONTO, UNIVERSITY OF
Toronto, Ontario
Faculty of Applied Science and Engineering
- Chemical Engineering 1965-
- Civil Engineering 1965-
- Computer Engineering 1994-
- Electrical Engineering 1965-
- Engineering Science 1965-
- Geo-Engineering 1983-1990
- Geological and Mineral Engineering 1991-1998
- Geological Engineering 1965-1974
- Geological Engineering and Applied Earth Science 1975-1982
- Industrial Engineering 1965-
- Materials Engineering 1996-
- Mechanical Engineering 1965-
- Metallurgical Engineering and Materials Science 1986-1995
- Metallurgy and Materials Science 1965-1985
- Mineral Engineering 1999-
- Year One – Common 1999-
VICTORIA, UNIVERSITY OF
Victoria, British Columbia
Faculty of Engineering
- Biomedical Engineering 2016-
- Civil Engineering 2017-
- Computer Engineering 1988-
- Electrical Engineering 1988-
- Mechanical Engineering 1992-
- Software Engineering 2007-
- Year One – Common 1980-
WATERLOO, UNIVERSITY OF
Waterloo, Ontario
Faculty of Engineering
- Chemical Engineering 1965-
- Civil Engineering 1965-
- Computer Engineering 1989-
- Electrical Engineering 1965-
- Environmental Engineering 1999-
- Geological Engineering 1986-
- Management Engineering 2012-
- Mechanical Engineering 1965-
- Mechatronics Engineering 2008-
- Nanotechnology Engineering 2010-
- Software Engineering 2006-
- Systems Design Engineering 1974-
WESTERN ONTARIO, THE UNIVERSITY OF
London, Ontario
Faculty of Engineering
- Chemical and Biochemical Engineering 1972-2006
- Chemical Engineering 1965-1971, 2007-
- Civil Engineering 1965-
- Computer Engineering 2001-
- Electrical Engineering 1965-
- Green Process Engineering 2012-
- Integrated Engineering 2001-
- Materials Engineering 1968-1999
- Mechanical Engineering 1965-
- Mechatronic Systems Engineering 2014-
- Software Engineering 2001-
- Year One – Common 1980-
WINDSOR, UNIVERSITY OF
Windsor, Ontario
Faculty of Engineering
- Chemical Engineering 1965-1990
- Civil Engineering 1965-
- Electrical Engineering 1965-
- Engineering Materials 1974-1991
- Environmental Engineering 1991-
- Geological Engineering 1972-1989
- Industrial Engineering 1974-
- Mechanical Engineering 1965-
- Year One – Common 1980-
YORK UNIVERSITY
Toronto, Ontario
Faculty of Science and Engineering
- Computer Engineering 2007-
- Electrical Engineering 2017-
- Geomatics Engineering 2007-
- Software Engineering 2016-
- Space Engineering 2007-
- Undeclared Major Engineering 2007-
Appendix C
Canadian discipline categories as used in this report
This section provides a comprehensive listing of program titles, as provided by the post-secondary, which are currently offered at both the undergraduate (accredited) and postgraduate levels in Canada only. The “discipline” listing is the broad category within which a number of similar programs are grouped. While this report does not provide detailed data on individual programs, the information can be obtained by contacting Engineers Canada.
Discipline: Biosystems
Program
- Agricultural and Bioresource Engineering
- Agricultural Engineering
- Bioengineering
- Biological and Biomedical Engineering
- Biological Engineering
- Biomedical and Mechanical
- Biomedical Engineering
- Biomedical Mechanical Engineering
- Biomedical: Computer Science
- BioResource Engineering
- Biosystems Engineering
- Chemical and Biological Engineering
- Forest Engineering
- Génie agroenvironnemental
- Génie alimentaire
- Génie biomédical
Discipline: Chemical
Program
- Chemical & Petroleum Engineering
- Chemical and Biochemical Engineering
- Chemical Engineering
- Chemical Engineering and Bioengineering
- Génie biotechnologique
- Génie chimique
- Nanotechnology Engineering
Discipline: Civil
Program
- Architectural Conservation and Sustainability
- Building Engineering
- Civil & Environmental Engineering
- Civil and Environmental Engineering
- Civil Engineering
- Génie civil
- Génie de la construction
- Génie du bâtiment
- Infrastructure Protection & International Security
- Safety and Risk Engineering
Discipline: Computer
Program
- Computational Science and Engineering
- Computer Engineering
- Computer Networks
- Computer Science
- Computer Systems Engineering
- Electronic Systems Engineering
- Engineering Systems and Computing
- Génie informatique
- Human Computer Interaction
- Systems - Electrical & Computer
Discipline: Electrical
Program
- Biomedical and Electrical
- Communications Engineering
- Electrical & Biomedical Engineering
- Electrical & Computer
- Electrical and Computer Engineering
- Electrical Engineering
- Electrical/Computer Engineering
- Electronic Business Technologies
- Energy Systems Engineering
- Génie des opérations et de la logistique
- Génie des technologies de l'information
- Génie électrique
- Génie électromécanique
- Génie énergétique
- Génie robotique
- Information systems security
- Quality Systems Engineering
- Sustainable Energy Engineering
Discipline: Engineering Physics
Program
- Engineering Chemistry
- Engineering Mathematics
- Engineering Physics
- Engineering Science
- Génie physique
- Mathematics and Engineering
- Mathématiques
- Mathématiques ingénieur
Discipline: Environmental
Program
- Clean Energy Engineering
- Environmental Engineering
- Environmental Systems Engineering
- Génie des eaux
- Maîtrise en génie de l'environnement
- Maîtrise en Science de la Terre
- Sustainable & Renewable Energy
- Water Resources Engineering
Discipline: Geological
Program
- Génie géologique
- Geological Engineering
Discipline: Industrial or Manufacturing
Program
- Advanced Design and Manufacturing Institute
- Génie de la production automatisée
- Génie industriel
- Industrial Engineering
- Industrial Systems Engineering
- Manufacturing Engineering
- Mechanical Manufacturing Engineering
Discipline: Materials or Metallurgical
Program
- Génie des matériaux et de la métallurgie
- Génie métallurgique
- Materials Engineering
- Materials Science
- Mining/Materials Engineering
Discipline: Mechanical
Program
- Automotive Engineering
- Energy Engineering
- Génie mécanique
- Mechanical & Manufacturing Engineering
- Mechanical & Materials Engineering
- Mechanical & Mechatronics Engineering
- Mechanical Engineering
- Mechanical Systems Engineering
- Mechanical/Industrial Engineering
- Mechatronic Systems Engineering
- Mechatronics Engineering
- Space Engineering
Discipline: Mining or Mineral
Program
- Génie des mines
- Génie des mines et de la minéralurgie
- Génie minéral
- Mineral and Mining Exploration Engineering
- Mineral Engineering
- Mineral Resources Engineering
- Mining Engineering
- Natural Resources Engineering
Discipline: Other
- Aeronautical Engineering
- Aerospace Engineering
- Centre for Business, Entrepreneurship & Technology
- Core Program
- Doctorat en ingénierie
- Doctorat en ressources minérales
- Engineering and Public Policy
- Engineering Design
- Engineering Entrepreneurship & Innovation
- Engineering Innovation and Entrepreneurship
- Engineering Management
- General Engineering
- Génie
- Génie aérospatial
- Génie des systèmes électromécaniques
- Génie du bois
- Génie géomatique
- Génie nucléaire
- Geomatics Engineering
- Green Process Engineering
- Information and Systems Engineering
- Ingénierie
- Integrated Engineering
- Interdisciplinary
- Internetworking
- Maîtrise en ingénierie
- Maîtrise en ingénierie (gestion)
- Management Engineering
- Management Sciences
- Nuclear Engineering
- Ocean and Naval Architectural Engineering
- Oil and Gas Engineering
- Petroleum Engineering
- Petroleum Systems Engineering
- Process Engineering
- Process Systems Engineering
- Science Engineering (Sustainable Design)
- Sciences appliquées
- Systems Design Engineering
- Systems Science
- Technologie des systèmes
- TIM (Systems)
- UNENE
Discipline: Software
Program
- Génie logiciel
- Information Systems Science
- Information Technology
- Software Engineering
- Software Engineering & Virtual Systems Design
- Software Systems Engineering
Year One/Two Common Year
- Undeclared Major Engineering
- Year One - Common
The discipline Engineering Science (E.Sci.) involves science-intensive studies in engineering physics, engineering bioscience, engineering chemistry and other specializations offered by universities with accredited engineering science programs.
Several universities in Canada have common first-year and, in some cases, second-year programs. Students in these programs do not declare a discipline of study in their first year or, as applicable, second year. The total number of students in common first-, second- and qualifying-year programs have been separated from the “Other” category, beginning with the 1997 data. This subdivision will be continued in future years.
Appendix D
Associated universities explained
Dalhousie University, Royal Military College of Canada (RMC), and Associated Universities
The bachelor of engineering degree awarded by Dalhousie University is normally conferred in association with one of several associated universities. The program of study is divided into two parts: the associated universities offer programs in engineering covering the first part of the requirements for the degree and the Faculty of Engineering at Dalhousie offers courses in several departments of engineering covering the second part. There are other higher education institutions in Canada that operate under this model. Under the Accreditation Board's regulations for granting credits, a formally documented validation procedure must be in place.
Some of the associated universities include the following:
- Acadia University
- University of Cape Breton
- Dalhousie University
- Mount Allison University (as of 2000, no longer offering engineering programs)
- Nova Scotia Agricultural College
- St. Francis Xavier University
- Saint Mary’s University
