Trends in Engineering Enrolment and Degrees Awarded 2011-2015
Message from the Chief Executive Officer
 The Enrolment and Degrees Awarded Report highlights strong growth in the number of students pursuing an engineering education.
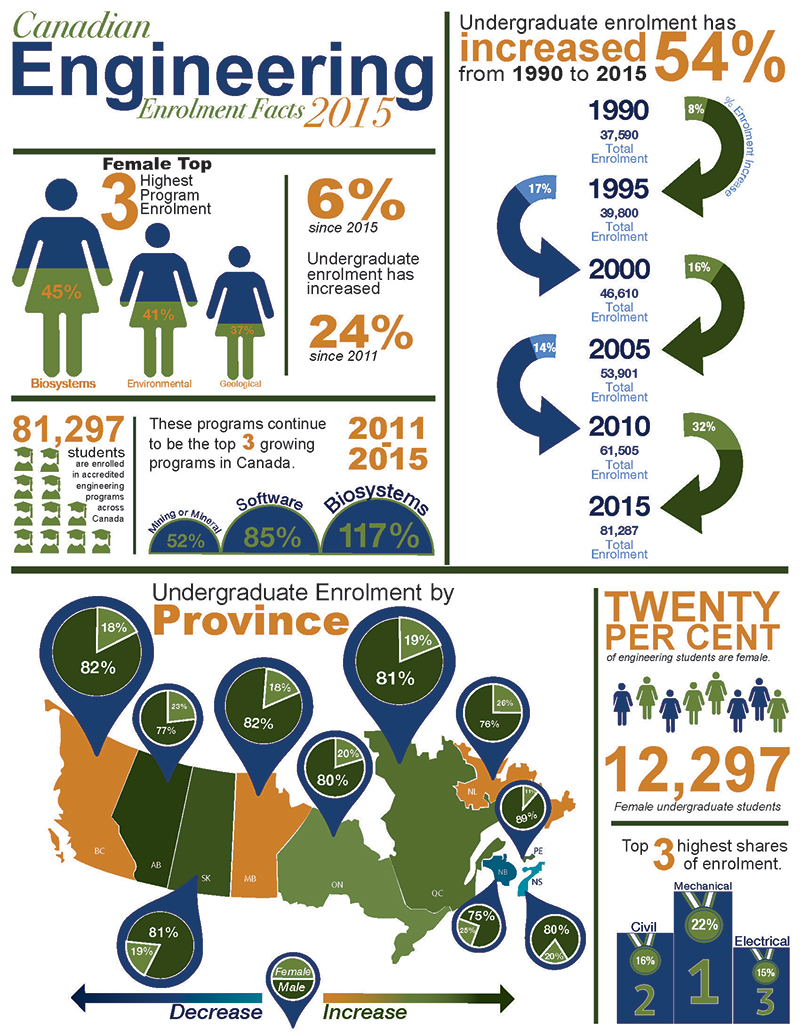
During the 2015 academic year, undergraduate enrolment continued to increase and demonstrated strong growth in the number of students pursuing an engineering education. Undergraduate enrolment increased a total of 24 per cent from 2011, reaching a total of 81,287 students in 2015. From the 2014 academic year, undergraduate enrolment increased six per cent while postgraduate enrolment increased seven per cent, to reach 24,421 students.
Canadian engineering programs continue to be a popular choice for international students. In 2015, the total number of undergraduate international students reached 13,001, accounting for 19 per cent of all undergraduate enrolments. It is encouraging to see that the number of degrees awarded continues to grow along with student enrolment. A total of 14,577 degrees were awarded to undergraduate students in 2015, a hefty 24 per cent increase from 2011. There were also 7,678 master’s degrees awarded in 2015, reflecting an increase of 23 per cent from 2014 and a 72 per cent from 2011. The number of doctoral degrees awarded followed similar trends, increasing three per cent from 2014 and 37 per cent from 2011.
For the first time, Engineers Canada collected information in 2016 regarding Indigenous students’ enrolment and degrees awarded. In 2015, less than one per cent of undergraduate students identified as Indigenous. Like the population of women in engineering programs, Indigenous peoples are significantly underrepresented. We will continue to track this information in the coming years to identify trends in Indigenous enrolment and degrees awarded.
Kim Allen, MBA, FCAE, FEC, P.Eng.
Chief Executive Officer
Engineers Canada
Acknowledgements
Engineers Canada gratefully acknowledges the contribution of data and information from the deans and associate deans of the engineering and applied science faculties at Canadian higher education institutions.
Cover Image Credit: University of Waterloo Faculty of Engineering/Jonathan Bielaski. Report By: Stefanie Wlotzki
Foreword
Each year, Engineers Canada gathers data on student enrolment and graduations from Canada’s higher education institutions. This report analyzes trends in engineering student enrolment within accredited engineering programs across the nation.
Understanding these trends enables Engineers Canada and other members of the profession to:
- Compare patterns in the changing number of students who enrol in and graduate from the various engineering programs offered in the provinces
- Assess the number of women, Indigenous peoples and international students who are pursuing engineering and education
- Exchange pertinent information about similar and distinctly different trends across disciplines and institutions
Introduction
The Engineering Enrolment and Degrees Awarded Report is an annual examination of Canada's undergraduate and postgraduate engineering programs that evaluates trends in part- and full-time student enrolment and degrees awarded over a five-year period. In 2015, 49 universities provided information on their enrolment, programs and degrees awarded.
The results highlight enrolment trends by discipline and institution, as well as the number of undergraduate and postgraduate degrees awarded each year. These results reveal trends specific to discipline, education and gender, as well as the number of engineering graduates available to enter the labour market, international students’ participation in Canadian engineering education, and students studying in co-op programs. Enrolment trends in undergraduate, master’s and doctoral levels are compared, along with men and women studying and graduating from engineering programs. In 2016, a series of questions regarding Indigenous peoples’ enrolment and graduation from engineering programs was piloted and results are presented in this report. Engineers Canada plans to continue this data collection in coming years to be able to identify emerging trends.
Data is provided by higher education institutions to Engineers Canada. Engineers Canada compiles the information in this report. Findings are then shared with Engineers Canada’s stakeholders and with the public.
Undergraduate student enrolment and degrees awarded
Undergraduate student enrolment
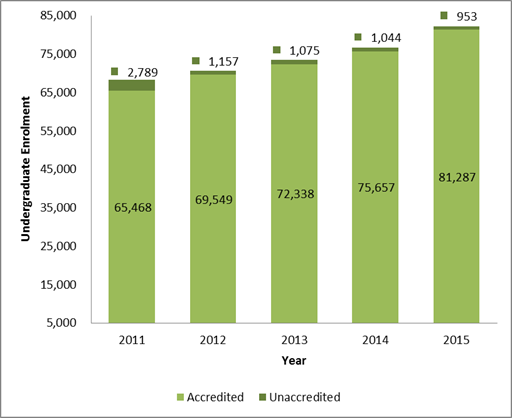
Undergraduate enrolment in accredited engineering programs has increased six per cent since 2014, and 24 per cent from 2011. In 2015, enrolment reached a total of 81,287 students in accredited engineering programs across Canada.
Chart 1.1 shows undergraduate enrolment in engineering programs, including students enrolled in unaccredited programs. The number of undergraduate engineering students in both accredited and unaccredited programs totaled 82,240 in 2015. This reflects an increase of seven per cent from 2014.
For more detailed data tabulations corresponding to each chart, refer to Appendix A.
Undergraduate enrolment by program
Chart 1.2 illustrates the trends occurring in enrolment by program. Mechanical, civil and electrical engineering programs continue to have the highest shares of enrolment with 22 per cent, 16 per cent and 15 per cent, respectively; however, these are not thefastest growing programs.
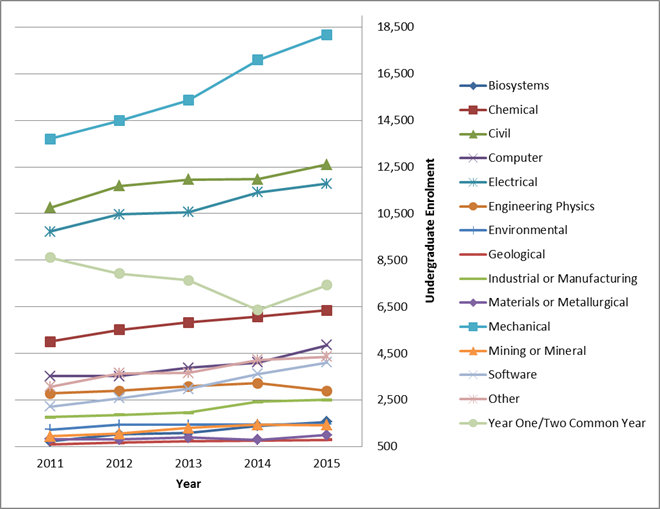
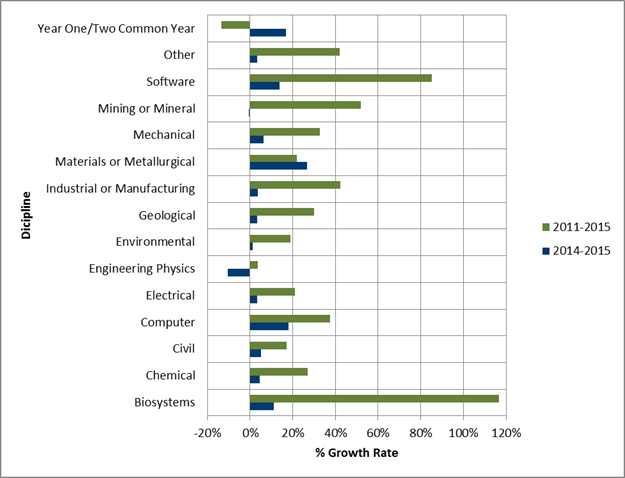
As shown in Chart 1.3, undergraduate enrolment in biosystems, software and mining or mineral engineering programs continue to grow the fastest, with an increase of 117 per cent, 85 per cent and 52 per cent, respectively, between 2011 and 2015. By contrast, enrolment in Year One/Two Common engineering programs continues to remain below 2011 levels, declining14 per centsince 2011. However, it did see a 17 per cent increase in enrolment in 2015.
Undergraduate enrolment by province
Ontario continues to be the province with the highest proportion of undergraduate enrolment, making up 44 per cent of total enrolment, an increase of five per cent from 2014. Following Ontario, Quebec makes up 26 per cent of undergraduate enrolment, rising six per cent from 2014. Since 2011, Ontario and Quebec are growing the fastest, along with Manitoba, with increases of 30 per cent, 33 per cent and 32 per cent, respectively.
Unlike in 2014, when Alberta saw the largest decrease in year-to-year enrolment, in 2015, Alberta had the highest increase, with an increase of 26 per cent over 2014. Taking Alberta’s place as the province with the largest decrease, enrolment in New Brunswick’s engineering programs decreased by nine per cent from 2011 to 2015 and by three per cent from 2014 to 2015.
For the third year in a row, Newfoundland and Labrador continues to have the highest percentage of female undergraduates with 26 per cent, increasing from 24 per cent in 2014. Prince Edward Island continues to be the province with the lowest percentage of female enrolment, where they make up only 11 per cent of the undergraduate engineering student population.
International students are enrolling in undergraduate engineering programs in greater amounts in Ontario (42 per cent), Quebec (24 per cent) and British Columbia (10 per cent). This contrasts with last year’s enrolment, where international students were enrolling in the maritime provinces—Prince Edward Island, Nova Scotia and New Brunswick.
Undergraduate enrolment by gender
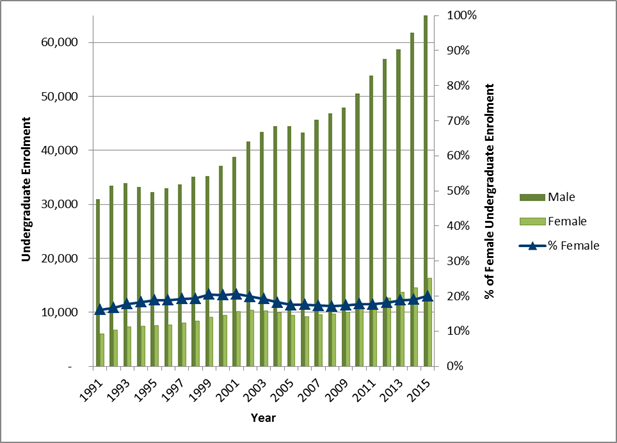
Female undergraduate enrolment follows similar trends with undergraduate student enrolment and continues to rise, reaching 16,297 undergraduate students, or 20 per cent of total enrolment, in 2015—a 12 per cent increase from 2014.
While the highest percentage of female undergraduate enrolment was in 2001, with 21 per cent of students, the percentages have been increasing at a rate about one per cent per year since 2008 (Chart 1.4). Should this trend continue, the percentage of female undergraduate students in 2016 should be on par with the 2001 numbers.
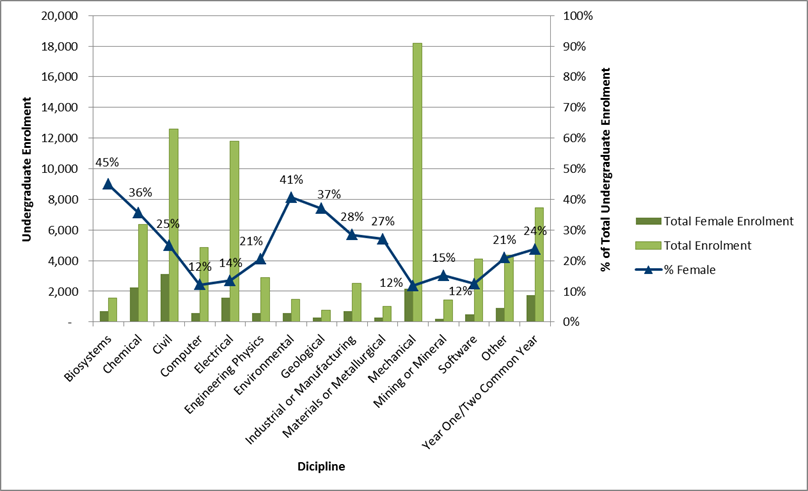
Chart 1.5 indicates that the top three disciplines with female enrolment are biosystems, environmental and geological engineering programs at 45 per cent, 41 per cent and 37 per cent, respectively. Even though these disciplines have the highest percentage of female enrolment, they do not have the highest female enrolment numbers. The civil (3,143), chemical (2,255) and mechanical (2,148) disciplines—have the largest female enrolment. The disciplines with the fewest number of females enrolled are computer, mechanical and software engineering at 12 per cent, or about 500 female students in each program.
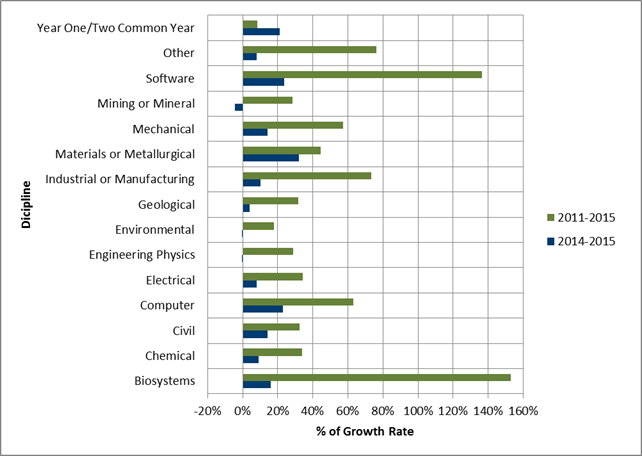
As shown in Chart 1.6, there has been steady growth in female enrolment in disciplines from 2011 to 2015. The disciplines with the most cumulative growth are biosystems, with a growth of 153 per cent, and software engineering with a growth of 137 per cent. Conversely, not all disciplines are growing; the percentage difference from 2014 to 2015, particularly in mining or mineral engineering, environmental, and engineering physics, follow a different trend, with negative four per cent, negative one per cent and negative one per cent growth, respectively. These three disciplines saw smaller female enrolment numbers in 2015.
Undergraduate enrolment of international students
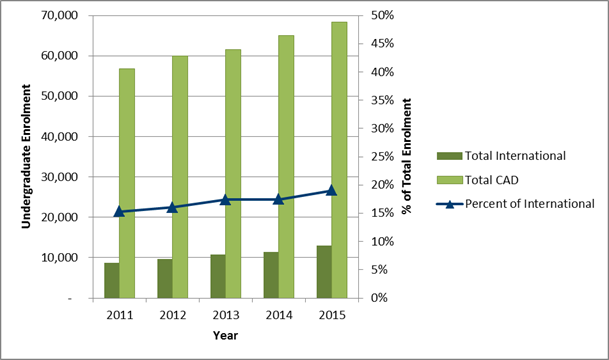
Chart 1.7 shows the number and proportion of international students, as well as the yearly growth in their enrolment. In 2015, the total number of international students accounts for 19 per cent of all undergraduate enrolments, reaching 13,001 students. This number is an important increase from 2014, when international student enrolment was at 15 per cent, or 11,354 students. Nonetheless, this growth rate is still significantly lower than from 2012 to 2013, where the increase in international students accounted for more than 39.9 percent of the overall increase in engineering student enrolment. Thus, the overall trend indicates a slowing rate of international students enrolling in Canadian undergraduate engineering programs.
Undergraduate degrees awarded
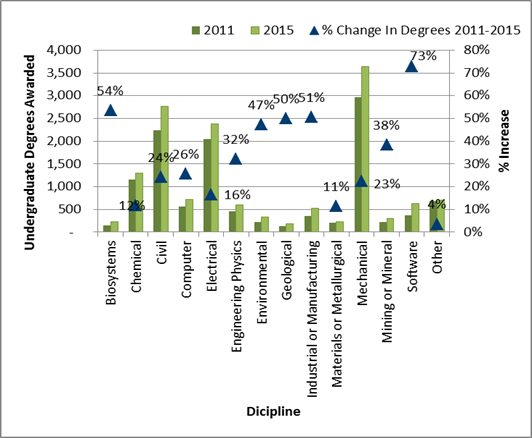
The number of undergraduate degrees awarded increased by 24 per cent from 2011, reaching 14,577 students in 2015. As shown in Chart 1.8, the program with the most undergraduate degrees awarded is mechanical engineering with 3,634 degrees in 2015. The fastest growing undergraduate degrees awarded, from 2011 to 2015 are software engineering degrees (73 per cent increase), biosystems engineering degrees (54 per cent increase) and industrial or manufacturing engineering degrees (51 per cent increase).
Similarly, Chart 1.9, which represents undergraduate degrees awarded to females, demonstrates that the number of degrees awarded to female undergraduates increased from 2011 to 2014. The percentage of females compared to males with undergraduate degrees has fluctuated throughout the five years presented in this report, with an average of 19 per cent of undergraduate degrees being awarded to females.
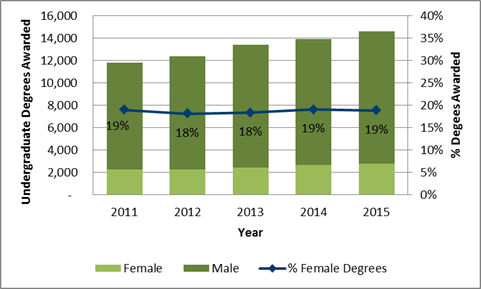
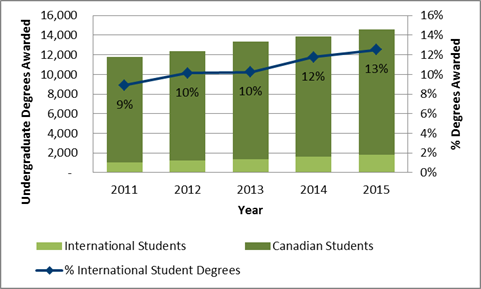
Chart 1.10 represents the trends of degrees awarded to international student and shows a steady increase, with nine per cent awarded in 2011 to international students and 13 per cent awarded in 2015.
Postgraduate enrolment and degrees awarded
Graduate student enrolment
Overall, postgraduate enrolment numbers increased seven per cent from 2014 to 2015 to 24,421 students. This is a dramatic increase compared to 2014 when the number of students enrolling declined 2.5 per cent from 2013 levels.
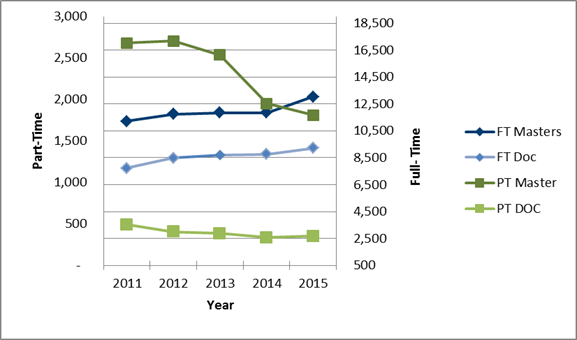
In 2015, master’s student enrolment increased while, in 2014, there was a decline at this level. The percentage of part-time master’s students continues to decline, only accounting for 12 per cent (1,812 students) of graduate students in 2015, compared to 19 per cent in 2011 (2,679).
Following the trends of master's degrees, both full- and part-time doctoral student enrolment increased from 2014 and from 2011 reaching a total of 9,570 students. Chart 2.1 illustrates the trends in part-time and full-time enrolment in master’s and doctoral programs.
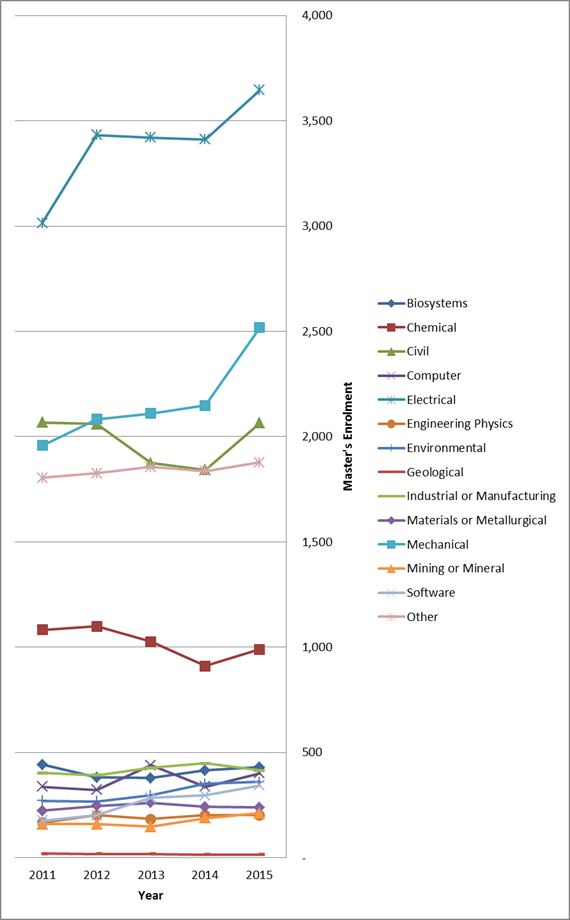
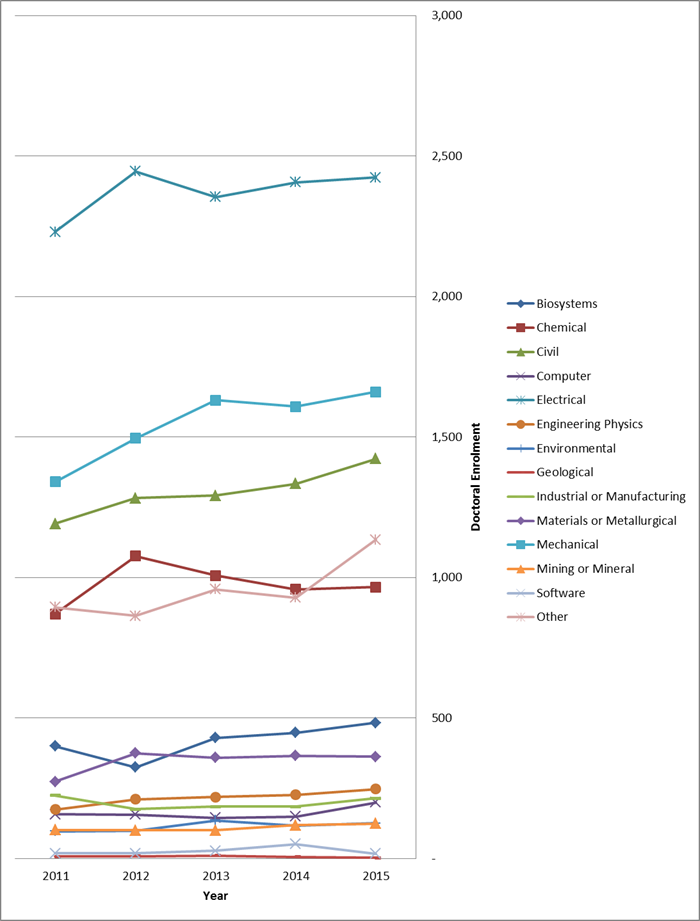
Charts 2.2 and 2.3 illustrate enrolment trends in both master’s and doctoral programs. Electrical engineering continues to have the most students enrolled in both levels, with 3,645 and 2,423 students, respectively. At both the master’s and doctoral levels, computer engineering has had the largest growth in student enrolment, with 19 per cent and 34 per cent, respectively.
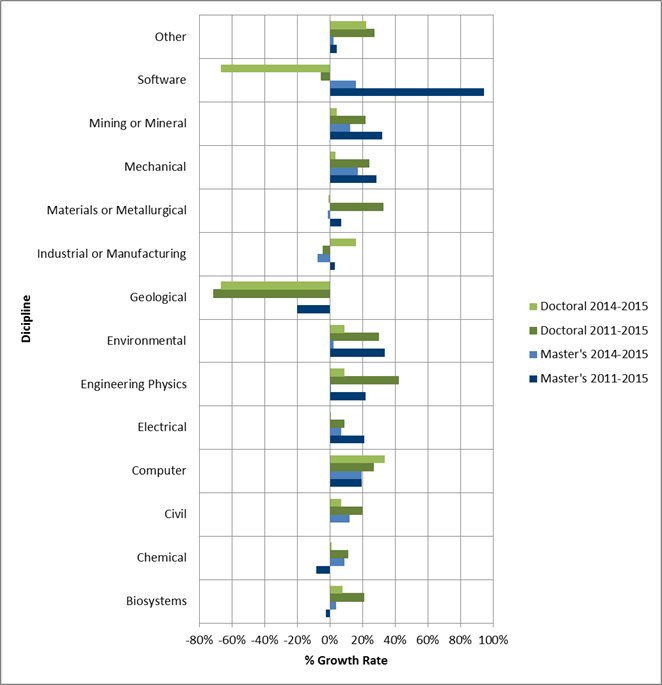
Conversely, doctoral enrolment in geological engineering has decreased the most since 2014, with a 67 per cent decrease. Materials and metallurgical engineering has decreased one per cent at the doctoral level. These trends are shown in Chart 2.4.
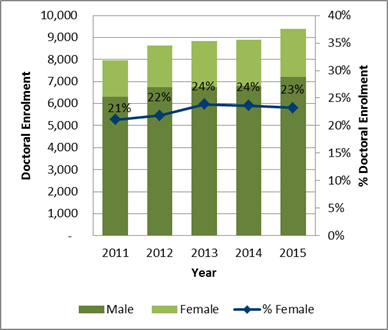
Postgraduate enrolment by gender
Trends in postgraduate enrolment by gender continue to stay mostly unchanged from 2014. There continues to be a higher proportion of female postgraduate enrolment (24 per cent) than undergraduate enrolment (20 per cent). Different from 2014, however, are the programs with the highest percentage of female enrolment. Electrical engineering has the highest percentage of female postgraduate enrolment with 23 percent, followed by civil engineering with 17 per cent and chemical with 12 per cent.
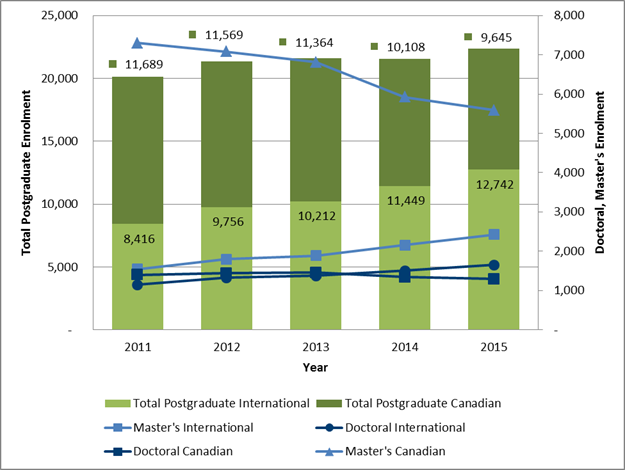
Postgraduate enrolment by international students
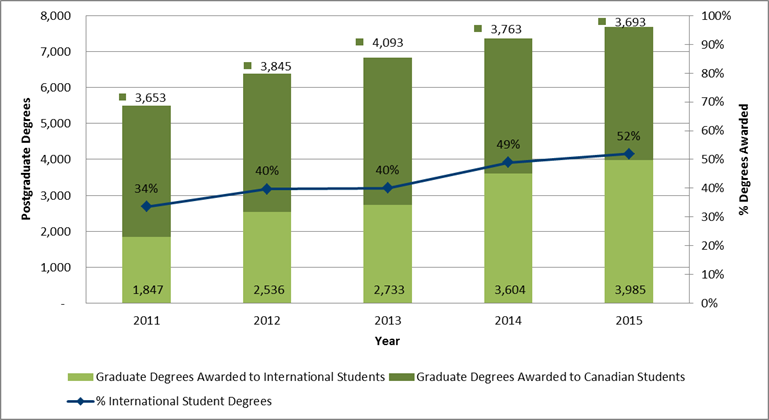
At 12,742 students, international students continue to account for over half of total postgraduate enrolment (57 per cent), increasing four per cent from 2014. While international student enrolment continues to increase, Canadian student enrolment in Canadian engineering programs continues to decrease, declining by three percent from 2014. Chart 2.7 illustrates that the growth in postgraduate enrolment from previous years is entirely the result of the increase in international students’ postgraduate enrolment, as Canadian postgraduate enrolment has been decreasing steadily.
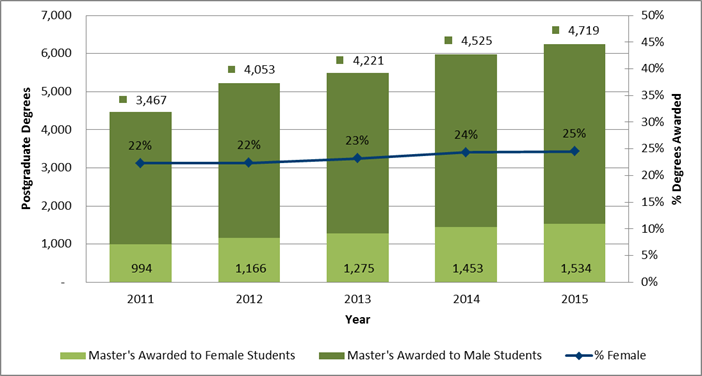
Postgraduate degrees awarded
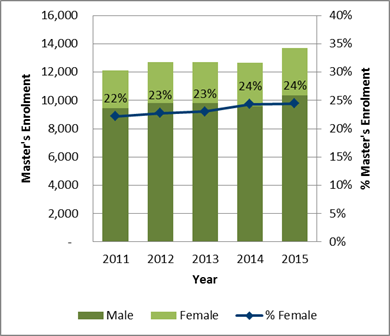
In 2015, there were 7,678 master’s degrees awarded, reflecting an increase of 23 per cent from 2014 and a 72 per cent increase from 2011. Master’s degrees awarded to female students account for 25 per cent and are consistent with the average female master’s degree enrolment rate of 23 per cent over the five years covered in this report. Chart 2.8 reflects this consistency and does not indicate any difference in gender completion rates.
Shown in Chart 2.9, in 2015, there were 1,425 doctorates awarded, reflecting an increase of three per cent from 2014 and a 37 per cent increase from 2011. Female doctorates account for 22 per cent of total doctoral degrees awarded in 2015, which is consistent with the proportion of female doctoral students (22 per cent).
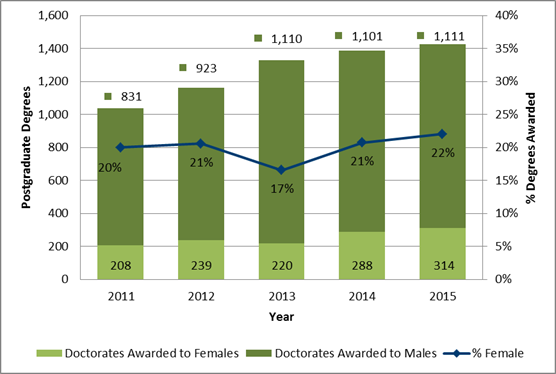
Chart 2.10 highlights the large increase in graduate degrees awarded to international students since 2011, in accordance with the large increase in international student postgraduate enrolment. Following similar trends to 2014, in 2015 the proportion of international student degrees awarded exceeded the average international student enrolment of 42 per cent over the five years and there were 3,985 international students that graduated.
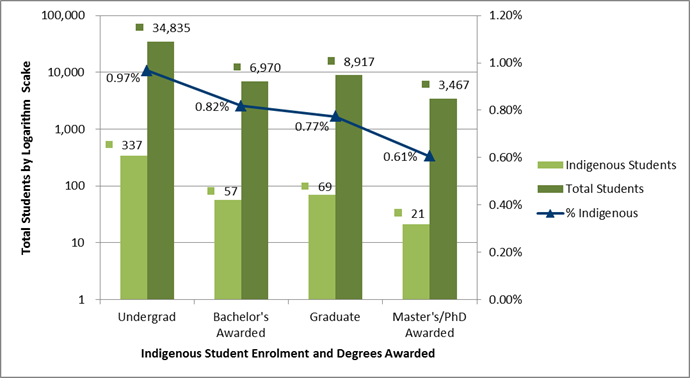
Undergraduate enrolment of Indigenous peoples
In 2016, a series of questions regarding Indigenous peoples’ enrolment and graduation from engineering programs was piloted. Chart 3.1 illustrates the enrolment and graduation of Indigenous students from Canadian engineering programs. Engineers Canada plans to continue this data collection in coming years to be able to identify relevant trends.
A total of 22 post-secondary institutions responded. Three of those were unable to find the information required to respond to the survey questions. Because of the small sample size, the information that is provided on Indigenous student enrolment is only provided in aggregate form to assure anonymity.
There were a total of 337 Indigenous students who enrolled in undergraduate studies and 147 that enrolled in a post-graduate program. Indigenous peoples are 0.97 per cent of undergraduate enrolment and 0.76 per cent of post-graduate enrolment. Indigenous peoples make up more than 4.3 per cent of the Canadian population.
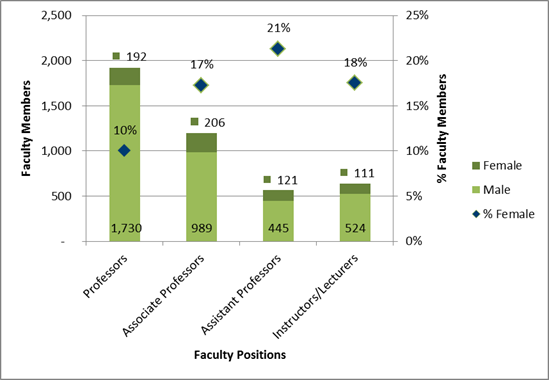
Faculty Members
As shown in Chart 3.2, faculty members decreased in 2015 by 0.1 per cent to 4,318. Female faculty members accounted for 14.6 per cent of all faculty members and increased one percent from 2014, but decreased by only one percent from 2011.
Appendix A
Data tabulations - engineering enrolment and degrees awarded
Data found in the following tables can also be downloaded in Excel format.
Undergraduate Enrolment (U)
- U.1. National
- U.2. Provincial
- U.3. Institutional
Undergraduate Degrees Awarded (UD)
- UD.1. National
- UD.2. Provincial
- UD.3. Institutional
Post-graduate Student Enrolment (G)
- G.1. National
- G.2. Provincial
- G.3. Institutional
Post-graduate Degrees Awarded (GD)
- GD.1. National
- GD.2. Provincial
- GD.3. Institutional
Faculty Members by Institution (F)
- F.1. Faculty Composition
Co-op, Internship and Professional Experience Programs (C)
- C.1. Industry Experience Options by Institutions
For 2007 and onwards, data are based on the average number of students enrolled over the fall, winter and summer terms.
School name and acronyms
In the Appendix section of this report, all university names, where appropriate, have been abbreviated. The chart shown below lists the complete name of the school and the abbreviated name that is used.
| Complete School Name | Abbreviation |
|---|---|
| Acadia University | Acadia |
| Alberta, University of | Alberta |
| British Columbia Institute of Technology | BCIT |
| British Columbia, University of | UBC |
| British Columbia at Okanagan, University of | UBCO |
| Calgary, The University of | Calgary |
| Cape Breton, University College of | Cape Breton |
| Carleton University | Carleton |
| Concordia University | Concordia |
| Conestoga College | Conestoga |
| Dalhousie University | Dal |
| École de technologie supérieure | ETS |
| Guelph, University of | Guelph |
| Lakehead University | Lakehead |
| Laurentian University | Laurentian |
| Laval, Université | Laval |
| Manitoba, The University of | Manitoba |
| McGill University | McGill |
| McMaster University | McMaster |
| Memorial University of Newfoundland | MUN |
| Moncton, Université de | Moncton |
| New Brunswick, University of | UNB |
| Northern British Columbia, University of | UNBC |
| Nova Scotia Agricultural College | NSAC |
| Ottawa, University of | Ottawa |
| Prince Edward Island, University of | UPEI |
| Polytechnique, École | Polytechnique |
| Québec à Chicoutimi, Université du | UQAC |
| Québec à Montréal, Université du | UQAM |
| Québec à Rimouski, Université du | UQAR |
| Québec à Trois-Rivières, Université du | UQTR |
| Québec en Abitibi-Témiscamingue, Université du | UQAT |
| Québec en Outaouais, Université du | UQO |
| Queen’s University | Queen's |
| Regina, University of | Regina |
| Royal Military College of Canada | RMC |
| Ryerson University | Ryerson |
| Saint Mary’s University | SMU |
| Saskatchewan, University of | Saskatchewan |
| Sherbrooke, Université de | Sherbrooke |
| Simon Fraser University | SFU |
| St. Francis Xavier University | StFX |
| Toronto, University of | Toronto |
| University of Ontario, Institute of Technology | UOIT |
| Victoria, University of | Uvic |
| Waterloo, University of | Waterloo |
| Western Ontario, University of | Western |
| Windsor, University of | Windsor |
| York University | York |
| Province Name | Abbreviation |
|---|---|
| Alberta | AB |
| British Columbia | BC |
| Manitoba | MB |
| New Brunswick | NB |
| Newfoundland and Labrador | NL |
| Nova Scotia | NS |
| Ontario | ON |
| Prince Edward Island | PE |
| Québec | QC |
| Saskatchewan | SK |
Undergraduate Enrolment (U)
| Discipline | 2011 | 2012 | 2013 | 2014 | 2015 |
|---|---|---|---|---|---|
| Biosystems | 719 | 1023 | 1080 | 1402 | 1558 |
| Chemical | 5000 | 5517 | 5825 | 6076 | 6347 |
| Civil | 10758 | 11681 | 11957 | 11974 | 12606 |
| Computer | 3526 | 3520 | 3873 | 4105 | 4849 |
| Electrical | 9727 | 10462 | 10556 | 11411 | 11778 |
| Engineering Physics | 2786 | 2894 | 3081 | 3222 | 2887 |
| Environmental | 1229 | 1440 | 1440 | 1444 | 1462 |
| Geological | 604 | 667 | 730 | 761 | 786 |
| Industrial or Manufacturing | 1766 | 1857 | 1959 | 2427 | 2513 |
| Materials or Metallurgical | 824 | 805 | 886 | 793 | 1004 |
| Mechanical | 13703 | 14489 | 15368 | 17091 | 18168 |
| Mining or Mineral | 936 | 1046 | 1304 | 1431 | 1423 |
| Software | 2222 | 2573 | 2974 | 3616 | 4114 |
| Other | 3063 | 3649 | 3662 | 4215 | 4354 |
| Year One/Two Common Year | 8605 | 7926 | 7642 | 6363 | 7438 |
| TOTAL | 65468 | 69549 | 72338 | 76330 | 81287 |
| Year | Total Enrolment | Women | Percent of total |
|---|---|---|---|
| 1991 | 36,923 | 5,947 | 16.1 |
| 1992 | 40,068 | 6,659 | 16.6 |
| 1993 | 41,329 | 7,348 | 17.8 |
| 1994 | 40,709 | 7,436 | 18.3 |
| 1995 | 39,800 | 7,505 | 18.9 |
| 1996 | 40,667 | 7,659 | 18.8 |
| 1997 | 41,675 | 8,006 | 19.2 |
| 1998 | 43,487 | 8,391 | 19.3 |
| 1999 | 44,390 | 9,103 | 20.5 |
| 2000 | 46,610 | 9,460 | 20.3 |
| 2001 | 48,929 | 10,089 | 20.6 |
| 2002 | 52,024 | 10,350 | 19.9 |
| 2003 | 53,718 | 10,317 | 19.2 |
| 2004 | 54,361 | 9,901 | 18.2 |
| 2005 | 53,901 | 9,435 | 17.5 |
| 2006 | 52,484 | 9,235 | 17.6 |
| 2007 | 55,190 | 9,561 | 17.3 |
| 2008 | 56,596 | 9,695 | 17.1 |
| 2009 | 57,970 | 10,062 | 17.4 |
| 2010 | 61,505 | 10,915 | 17.7 |
| 2011 | 65,468 | 11,563 | 17.7 |
| 2012 | 69,549 | 12,609 | 18.1 |
| 2013 | 72,338 | 13,652 | 18.9 |
| 2014 | 76,330 | 14,527 | 19 |
| 2015 | 81,287 | 16,297 | 20 |
| Discipline | 2011 | 2012 | 2013 | 2014 | 2015 |
|---|---|---|---|---|---|
| Biosystems | 277 | 439 | 450 | 603 | 700 |
| Chemical | 1,686 | 1,826 | 1,920 | 2,067 | 2,255 |
| Civil | 2,370 | 2,556 | 2,718 | 2,755 | 3,143 |
| Computer | 360 | 355 | 416 | 478 | 587 |
| Electrical | 1,185 | 1,297 | 1,367 | 1,471 | 1,591 |
| Engineering Physics | 461 | 497 | 555 | 597 | 594 |
| Environmental | 504 | 565 | 571 | 597 | 594 |
| Geological | 221 | 245 | 268 | 280 | 291 |
| Industrial or Manufacturing | 412 | 441 | 489 | 647 | 714 |
| Materials or Metallurgical | 188 | 188 | 219 | 206 | 272 |
| Mechanical | 1,367 | 1,502 | 1,672 | 1,882 | 2,148 |
| Mining or Mineral | 168 | 186 | 191 | 226 | 216 |
| Software | 216 | 253 | 330 | 413 | 511 |
| Other | 518 | 657 | 722 | 843 | 912 |
| Year One/Two Common Year | 1,630 | 1,600 | 1,764 | 1,462 | 1,769 |
| TOTAL | 11,563 | 12,609 | 13,652 | 14,527 | 16,297 |
| Institution | Program | 015 |
|---|---|---|
| Calgary | Energy Engineering | 48 |
| Laurentian | Civil Engineering | 11 |
| Laval | Génie industriel | 135 |
| McGill | General Engineering | 58 |
| UOIT | Energy Systems Engineering | 49 |
| UQO | Génie électrique | 36 |
| UVic | Biomedical Engineering | 65 |
| UVic | Civil Engineering | 114 |
| Waterloo | Biomedical Engineering | 69 |
| York | Civil Engineering | 88 |
| York | Electrical Engineering | 81 |
| York | Mechanical Engineering | 92 |
| York | Software Engineering | 61 |
| York | Undeclared Major Engineering | 48 |
| TOTAL | 953 |
| Province | 2011 | 2012 | 2013 | 2014 | 2015 |
|---|---|---|---|---|---|
| AB | 6,897 | 7,154 | 7,334 | 5,818 | 7,317 |
| BC | 7,158 | 8,168 | 6,935 | 7,386 | 7,644 |
| MB | 1,154 | 1,255 | 1,412 | 1,483 | 1,521 |
| NB | 2,018 | 2,141 | 2,025 | 1,886 | 1,836 |
| NL | 873 | 859 | 937 | 989 | 1,030 |
| NS | 1,777 | 1,863 | 2,049 | 2,137 | 2,093 |
| ON | 27,522 | 28,904 | 30,288 | 34,089 | 35,868 |
| PE | 103 | 111 | 126 | 120 | 128 |
| QC | 15,814 | 16,969 | 18,659 | 19,839 | 21,073 |
| SK | 2,152 | 2,126 | 2,574 | 2,584 | 2,778 |
| TOTAL | 65,468 | 69,550 | 72,339 | 76,331 | 81,288 |
| Province | Total Enrolment | Female Enrolment | Percent Female Enrolment |
|---|---|---|---|
| AB | 7,317 | 1,684 | 23.00% |
| BC | 7,644 | 1,393 | 18.20% |
| MB | 1,521 | 277 | 18.20% |
| NB | 1,836 | 451 | 24.60% |
| NL | 1,030 | 269 | 26.10% |
| NS | 2,093 | 421 | 20.10% |
| ON | 35,868 | 7,362 | 20.50% |
| PE | 128 | 14 | 11.00% |
| QC | 21,073 | 3,904 | 18.50% |
| SK | 2,778 | 522 | 18.80% |
| TOTAL | 81,288 | 16,297 | 20.00% |
| Province | 2011 | 2012 | 2013 | 2014 | 2015 |
|---|---|---|---|---|---|
| AB | 655 | 738 | 795 | 644 | 929 |
| BC | 829 | 1,014 | 1,018 | 1,177 | 1,359 |
| MB | 149 | 185 | 245 | 276 | 258 |
| NB | 611 | 659 | 674 | 451 | 617 |
| NL | 89 | 86 | 95 | 102 | 109 |
| NS | 318 | 440 | 479 | 513 | 536 |
| ON | 3,474 | 3,778 | 4,197 | 4,841 | 5,430 |
| PE | 12 | 12 | 20 | 30 | 30 |
| QC | 2,157 | 2,290 | 2,623 | 2,743 | 3,074 |
| SK | 385 | 405 | 573 | 577 | 659 |
| TOTAL | 8,679 | 9,607 | 10,719 | 11,354 | 13,001 |
| Discipline | AB | BC | MB | NB | NL | NS | ON | PE | QC | SK | Total |
|---|---|---|---|---|---|---|---|---|---|---|---|
| Biosystems | 75 | 115 | 1,084 | 280 | 5 | 1,558 | |||||
| Chemical | 953 | 198 | 180 | 102 | 3,560 | 1,141 | 214 | 6,347 | |||
| Civil | 1,012 | 728 | 251 | 580 | 154 | 116 | 4,690 | 4,877 | 198 | 12,606 | |
| Computer | 188 | 401 | 104 | 20 | 53 | 2,828 | 1,051 | 205 | 4,849 | ||
| Electrical | 1,006 | 1,388 | 302 | 286 | 82 | 152 | 5,079 | 3,387 | 96 | 11,778 | |
| Engineering Physics | 50 | 1,024 | 1,516 | 255 | 42 | 2,887 | |||||
| Environmental | 146 | 53 | 910 | 87 | 265 | 1,462 | |||||
| Geological | 120 | 62 | 265 | 263 | 76 | 786 | |||||
| Industrial or Manufacturing | 107 | 804 | 1,285 | 318 | 2,513 | ||||||
| Materials or Metallurgical | 162 | 133 | 26 | 391 | 292 | 1,004 | |||||
| Mechanical | 1,576 | 1,704 | 459 | 468 | 237 | 182 | 7,962 | 5,347 | 235 | 18,168 | |
| Mining or Mineral | 176 | 143 | 93 | 492 | 520 | 1,423 | |||||
| Software | 158 | 171 | 91 | 1,676 | 1,907 | 111 | 4,114 | ||||
| Other | 517 | 141 | 86 | 176 | 757 | 1,928 | 382 | 368 | 4,354 | ||
| Year One/Two Common Year | 1,520 | 1,272 | 290 | 62 | 330 | 505 | 2,684 | 128 | 647 | 7,438 | |
| TOTAL | 7,318 | 7,644 | 1,521 | 1,835 | 1,032 | 2,093 | 35,868 | 128 | 21,074 | 2,780 | 81,287 |
| Discipline | AB | BC | MB | NB | NL | NS | ON | PE | QC | SK | Total |
|---|---|---|---|---|---|---|---|---|---|---|---|
| Biosystems | 32 | 50 | 480 | 136 | 1 | 700 | |||||
| Chemical | 307 | 71 | 59 | 37 | 1,231 | 492 | 60 | 2,255 | |||
| Civil | 330 | 144 | 53 | 221 | 45 | 27 | 1,176 | 1,096 | 52 | 3,143 | |
| Computer | 24 | 63 | 16 | 1 | 5 | 356 | 107 | 16 | 587 | ||
| Electrical | 174 | 162 | 44 | 56 | 15 | 16 | 715 | 401 | 8 | 1,591 | |
| Engineering Physics | 6 | 187 | 342 | 54 | 4 | 594 | |||||
| Environmental | 64 | 22 | 365 | 37 | 106 | 594 | |||||
| Geological | 46 | 20 | 101 | 107 | 17 | 291 | |||||
| Industrial or Manufacturing | 25 | 251 | 395 | 43 | 714 | ||||||
| Materials or Metallurgical | 40 | 29 | 5 | 120 | 78 | 272 | |||||
| Mechanical | 238 | 203 | 53 | 59 | 42 | 19 | 889 | 625 | 22 | 2,148 | |
| Miningor Mineral | 18 | 18 | 9 | 93 | 79 | 216 | |||||
| Software | 25 | 14 | 11 | 218 | 231 | 12 | 511 | ||||
| Other | 126 | 31 | 13 | 66 | 163 | 389 | 65 | 59 | 912 | ||
| Year One/Two Common Year | 396 | 329 | 61 | 12 | 98 | 101 | 636 | 14 | 123 | 1,769 | |
| TOTAL | 1,684 | 1,393 | 277 | 452 | 271 | 424 | 7,362 | 14 | 3,905 | 523 | 16,297 |
| Institution | 2011 | 2012 | 2013 | 2014 | 2015 |
|---|---|---|---|---|---|
| Acadia | 101 | 207 | 171 | 153 | 153 |
| Alberta | 3,904 | 4,021 | 4,145 | 3,277 | 4,222 |
| BCIT | 465 | 469 | 486 | 784 | 882 |
| Calgary | 2,993 | 3,133 | 3,189 | 2,541 | 3,095 |
| CapeBreton | 84 | 118 | 83 | 54 | 41 |
| Carleton | 2,698 | 3,186 | 3,228 | 3,511 | 4,022 |
| Concordia | 2,787 | 2,610 | 3,090 | 3,228 | 3,463 |
| Conestoga | 80 | 80 | 98 | 161 | 176 |
| Dal | 1,273 | 1,208 | 1,343 | 1,508 | 1,588 |
| ETS | 3,654 | 3,921 | 4,382 | 5,762 | 5,201 |
| Guelph | 528 | 530 | 942 | 1,320 | 1,392 |
| Lakehead | 796 | 806 | 798 | 849 | 1,006 |
| Laurentian | 442 | 279 | 382 | 544 | 481 |
| Laval | 1,683 | 1,841 | 1,987 | 1,059 | 2,308 |
| Manitoba | 1,154 | 1,255 | 1,412 | 1,483 | 1,521 |
| McGill | 2,257 | 2,259 | 2,649 | 2,769 | 2,826 |
| McMaster | 2,731 | 2,338 | 2,737 | 3,330 | 3,473 |
| Moncton | 338 | 367 | 358 | 343 | 422 |
| MUN | 873 | 859 | 937 | 989 | 1,030 |
| NSAC | 59 | 31 | 65 | 72 | 19 |
| Ottawa | 1,805 | 2,030 | 2,340 | 2,661 | 3,009 |
| Polytechnique | 3,644 | 4,197 | 4,305 | 4,704 | 4,896 |
| Queen's | 2,687 | 2,734 | 2,745 | 2,811 | 2,546 |
| Regina | 878 | 876 | 1,157 | 1,166 | 1,389 |
| RMC | 431 | 440 | 513 | 418 | 416 |
| Ryerson | 2,569 | 3,036 | 3,193 | 3,632 | 3,913 |
| Saskatchewan | 1,274 | 1,251 | 1,418 | 1,417 | 1,390 |
| SFU | 945 | 990 | 1,120 | 1,245 | 1,215 |
| Sherbrooke | 1,248 | 1,248 | 1,339 | 1,358 | 1,459 |
| SMU | 167 | 214 | 297 | 281 | 214 |
| StFX | 93 | 85 | 90 | 70 | 79 |
| Toronto | 4,386 | 4,488 | 4,560 | 4,672 | 4,745 |
| UBC | 3,800 | 3,873 | 3,699 | 3,501 | 3,537 |
| UBCO | 884 | 1,650 | 262 | 396 | 387 |
| UNB | 1,680 | 1,774 | 1,667 | 1,543 | 1,414 |
| UNBC | 73 | 89 | 84 | 85 | 89 |
| UOIT | 1,243 | 1,370 | 763 | 1,633 | 1,787 |
| UPEI | 103 | 111 | 126 | 120 | 128 |
| UQAC | 208 | 365 | 358 | 370 | 387 |
| UQAM | 27 | 42 | 42 | 47 | |
| UQAR | 86 | 81 | 89 | 88 | 114 |
| UQAT | 54 | 55 | 62 | 63 | 63 |
| UQO | 3 | 35 | 30 | 29 | 28 |
| UQTR | 163 | 314 | 327 | 362 | 329 |
| UVic | 992 | 1,098 | 1,284 | 1,374 | 1,534 |
| Waterloo | 4,622 | 5,047 | 5,182 | 5,315 | 5,456 |
| Western | 1,324 | 1,260 | 1,321 | 1,582 | 1,695 |
| Windsor | 985 | 1,064 | 1,245 | 1,468 | 1,540 |
| York | 195 | 218 | 241 | 183 | 211 |
| TOTAL | 65,469 | 69,553 | 72,341 | 76,331 | 81,291 |
| Institution | 2011 | 2012 | 2013 | 2014 | 2015 |
|---|---|---|---|---|---|
| Acadia | 23 | 27 | 38 | 31 | 37 |
| Alberta | 774 | 800 | 827 | 658 | 893 |
| BCIT | 37 | 39 | 42 | 59 | 62 |
| Calgary | 701 | 747 | 773 | 645 | 791 |
| Cape Breton | 14 | 16 | 18 | 10 | 4 |
| Carleton | 370 | 446 | 450 | 504 | 669 |
| Concordia | 471 | 490 | 606 | 645 | 705 |
| Conestoga | 9 | 5 | 5 | 10 | 8 |
| Dal | 241 | 229 | 262 | 291 | 321 |
| ETS | 325 | 353 | 385 | 507 | 458 |
| Guelph | 160 | 167 | 228 | 362 | 388 |
| Lakehead | 64 | 77 | 88 | 88 | 130 |
| Laurentian | 74 | 41 | 52 | 84 | 81 |
| Laval | 311 | 336 | 361 | 214 | 427 |
| Manitoba | 194 | 217 | 250 | 275 | 277 |
| McGill | 510 | 496 | 604 | 646 | 684 |
| McMaster | 434 | 418 | 514 | 587 | 686 |
| Moncton | 60 | 63 | 65 | 65 | 207 |
| MUN | 183 | 188 | 243 | 241 | 269 |
| NSAC | 6 | 5 | 9 | 17 | 1 |
| Ottawa | 325 | 409 | 445 | 527 | 595 |
| Polytechnique | 755 | 914 | 992 | 1,168 | 1,269 |
| Queen's | 687 | 741 | 775 | 815 | 780 |
| Regina | 184 | 168 | 266 | 249 | 251 |
| RMC | 46 | 60 | 71 | 51 | 48 |
| Ryerson | 377 | 522 | 539 | 638 | 738 |
| Saskatchewan | 247 | 243 | 279 | 277 | 272 |
| SFU | 120 | 133 | 155 | 187 | 197 |
| Sherbrooke | 194 | 190 | 213 | 207 | 214 |
| SMU | 20 | 25 | 42 | 42 | 32 |
| StFX | 23 | 20 | 26 | 22 | 27 |
| Toronto | 1,024 | 1,068 | 1,116 | 1,198 | 1,282 |
| UBC | 732 | 760 | 783 | 787 | 863 |
| UBCO | 98 | 205 | 32 | 49 | 48 |
| UNB | 278 | 278 | 255 | 277 | 244 |
| UNBC | 33 | 43 | 38 | 32 | 35 |
| UOIT | 90 | 100 | 66 | 111 | 144 |
| UPEI | 25 | 12 | 18 | 10 | 14 |
| UQAC | 27 | 45 | 53 | 58 | 64 |
| UQAM | 2 | 3 | 3 | 4 | |
| UQAR | 7 | 15 | 13 | 8 | 6 |
| UQAT | 10 | 12 | 13 | 12 | 9 |
| UQO | 1 | 4 | 3 | 5 | 7 |
| UQTR | 18 | 43 | 50 | 69 | 62 |
| UVic | 90 | 98 | 133 | 151 | 188 |
| Waterloo | 777 | 915 | 975 | 1,058 | 1,188 |
| Western | 250 | 242 | 261 | 312 | 343 |
| Windsor | 130 | 145 | 178 | 236 | 242 |
| York | 33 | 38 | 42 | 32 | 41 |
| TOTAL | 11,564 | 12,611 | 13,655 | 14,531 | 16,301 |
| Institution |
Biosystems
|
Chemical
|
Civil
|
Computer
|
Electrical
|
Engineering Physics
|
Environmental
|
Geological
|
Industrial or Manufacturing
|
Materials or Metallurgical
|
Mechanical
|
Mining or Mineral
|
Software
|
Other
|
Year One/Two Common Year
|
|
|---|---|---|---|---|---|---|---|---|---|---|---|---|---|---|---|---|
| Acadia | 153 | |||||||||||||||
| Alberta | 603 | 648 | 188 | 442 | 50 | 162 | 906 | 176 | 224 | 823 | ||||||
| BCIT | 190 | 389 | 303 | |||||||||||||
| Calgary | 350 | 364 | 564 | 670 | 158 | 293 | 697 | |||||||||
| CapeBreton | 41 | |||||||||||||||
| Carleton | 167 | 0 | 802 | 302 | 927 | 119 | 323 | 593 | 268 | 521 | ||||||
| Concordia | 999 | 187 | 387 | 308 | 1,085 | 497 | ||||||||||
| Conestoga | 57 | 120 | ||||||||||||||
| Dal | 102 | 116 | 152 | 53 | 107 | 26 | 182 | 93 | 757 | |||||||
| ETS | 1,589 | 1,340 | 397 | 1,297 | 577 | |||||||||||
| Guelph | 363 | 172 | 346 | 512 | ||||||||||||
| Lakehead | 102 | 361 | 175 | 334 | 34 | |||||||||||
| Laurentian | 139 | 168 | 174 | |||||||||||||
| Laval | 126 | 131 | 551 | 126 | 186 | 87 | 99 | 73 | 473 | 189 | 161 | 106 | ||||
| Manitoba | 115 | 251 | 104 | 302 | 459 | 290 | ||||||||||
| McGill | 385 | 387 | 158 | 556 | 219 | 739 | 144 | 238 | ||||||||
| McMaster | 371 | 381 | 175 | 459 | 127 | 191 | 590 | 299 | 880 | |||||||
| Moncton | 250 | 75 | 97 | |||||||||||||
| MUN | 154 | 53 | 82 | 237 | 176 | 330 | ||||||||||
| NSAC | 19 | |||||||||||||||
| Ottawa | 239 | 495 | 640 | 254 | 486 | 635 | 261 | |||||||||
| Polytechnique | 154 | 381 | 917 | 299 | 437 | 255 | 123 | 459 | 1,008 | 187 | 434 | 242 | ||||
| Queen's | 334 | 313 | 175 | 206 | 418 | 173 | 197 | 731 | ||||||||
| Regina | 148 | 213 | 318 | 111 | 368 | 231 | ||||||||||
| RMC | 42 | 59 | 37 | 37 | 45 | 72 | 124 | |||||||||
| Ryerson | 315 | 387 | 697 | 319 | 681 | 246 | 753 | 452 | 65 | |||||||
| Saskatchewan | 5 | 214 | 198 | 57 | 96 | 42 | 52 | 76 | 235 | 416 | ||||||
| SFU | 812 | 403 | ||||||||||||||
| Sherbrooke | 231 | 289 | 222 | 282 | 435 | |||||||||||
| SMU | 214 | |||||||||||||||
| StFX | 79 | |||||||||||||||
| Toronto | 552 | 461 | 486 | 753 | 852 | 369 | 200 | 733 | 121 | 220 | ||||||
| UBC | 75 | 198 | 401 | 339 | 513 | 212 | 57 | 120 | 133 | 386 | 143 | 141 | 819 | |||
| UBCO | 137 | 66 | 184 | |||||||||||||
| UNB | 180 | 330 | 20 | 211 | 62 | 371 | 91 | 86 | 62 | |||||||
| UNBC | 89 | |||||||||||||||
| UOIT | 383 | 56 | 918 | 191 | 239 | |||||||||||
| UPEI | 128 | |||||||||||||||
| UQAC | 145 | 30 | 63 | 41 | 107 | |||||||||||
| UQAR | 26 | 54 | 33 | |||||||||||||
| UQAT | 29 | 34 | ||||||||||||||
| UQO | 28 | |||||||||||||||
| UQTR | 13 | 80 | 121 | 115 | ||||||||||||
| UVic | 62 | 420 | 428 | 171 | 453 | |||||||||||
| Waterloo | 946 | 483 | 716 | 557 | 196 | 92 | 1,425 | 480 | 563 | |||||||
| Western | 194 | 208 | 46 | 130 | 350 | 144 | 44 | 579 | ||||||||
| Windsor | 286 | 285 | 45 | 133 | 705 | 86 | ||||||||||
| York | 92 | 83 | 37 | |||||||||||||
| TOTAL | 1,559 | 6,350 | 12,607 | 4,852 | 11,777 | 2,887 | 1,461 | 786 | 2,514 | 1,004 | 18,168 | 1,422 | 4,115 | 4,354 | 7,440 |
| Institution |
Biosystems
|
Chemical
|
Civil
|
Computer
|
Electrical
|
Engineering Physics
|
Environmental
|
Geological
|
Industrial or Manufacturing
|
Materials or Metallurgical
|
Mechanical
|
Mining or Mineral
|
Software
|
Other
|
Year One/Two Common Year
|
|
|---|---|---|---|---|---|---|---|---|---|---|---|---|---|---|---|---|
| Acadia | 37 | |||||||||||||||
| Alberta | 189 | 199 | 24 | 61 | 6 | 40 | 112 | 18 | 40 | 204 | ||||||
| BCIT | 24 | 23 | 15 | |||||||||||||
| Calgary | 118 | 131 | 113 | 126 | 25 | 86 | 192 | |||||||||
| CapeBreton | 4 | |||||||||||||||
| Carleton | 59 | 0 | 201 | 27 | 125 | 16 | 100 | 46 | 29 | 66 | ||||||
| Concordia | 274 | 17 | 65 | 127 | 141 | 81 | ||||||||||
| Conestoga | 2 | 6 | ||||||||||||||
| Dal | 37 | 27 | 16 | 22 | 25 | 5 | 19 | 9 | 163 | |||||||
| ETS | 234 | 110 | 29 | 59 | 25 | |||||||||||
| Guelph | 173 | 21 | 142 | 52 | ||||||||||||
| Lakehead | 32 | 48 | 8 | 40 | 3 | |||||||||||
| Laurentian | 37 | 17 | 27 | |||||||||||||
| Laval | 57 | 47 | 102 | 11 | 17 | 37 | 34 | 13 | 37 | 24 | 23 | 25 | ||||
| Manitoba | 50 | 53 | 16 | 44 | 53 | 61 | ||||||||||
| McGill | 160 | 131 | 22 | 101 | 65 | 133 | 28 | 43 | ||||||||
| McMaster | 122 | 86 | 20 | 95 | 14 | 51 | 75 | 38 | 185 | |||||||
| Moncton | 149 | 39 | 19 | |||||||||||||
| MUN | 45 | 5 | 15 | 42 | 66 | 98 | ||||||||||
| NSAC | 1 | |||||||||||||||
| Ottawa | 104 | 165 | 134 | 36 | 46 | 75 | 36 | |||||||||
| Polytechnique | 79 | 204 | 258 | 36 | 75 | 54 | 60 | 196 | 184 | 26 | 59 | 38 | ||||
| Queen's | 150 | 130 | 29 | 36 | 102 | 80 | 40 | 214 | ||||||||
| Regina | 12 | 82 | 43 | 12 | 59 | 42 | ||||||||||
| RMC | 12 | 6 | 3 | 5 | 10 | 3 | 9 | |||||||||
| Ryerson | 144 | 122 | 146 | 35 | 75 | 77 | 58 | 64 | 18 | |||||||
| Saskatchewan | 1 | 60 | 52 | 4 | 8 | 4 | 24 | 17 | 22 | 81 | ||||||
| SFU | 156 | 40 | ||||||||||||||
| Sherbrooke | 79 | 63 | 13 | 15 | 44 | |||||||||||
| SMU | 32 | |||||||||||||||
| StFX | 27 | |||||||||||||||
| Toronto | 223 | 155 | 87 | 151 | 210 | 143 | 69 | 140 | 26 | 79 | ||||||
| UBC | 32 | 71 | 96 | 61 | 93 | 31 | 29 | 46 | 29 | 85 | 18 | 31 | 241 | |||
| UBCO | 24 | 6 | 18 | |||||||||||||
| UNB | 59 | 72 | 1 | 17 | 20 | 40 | 11 | 13 | 12 | |||||||
| UNBC | 35 | |||||||||||||||
| UOIT | 32 | 5 | 61 | 16 | 30 | |||||||||||
| UPEI | 14 | |||||||||||||||
| UQAC | 33 | 2 | 4 | 13 | 11 | |||||||||||
| UQAR | 1 | 2 | 3 | |||||||||||||
| UQAT | 4 | 5 | ||||||||||||||
| UQO | 7 | |||||||||||||||
| UQTR | 2 | 9 | 42 | 9 | ||||||||||||
| UVic | 2 | 40 | 44 | 14 | 88 | |||||||||||
| Waterloo | 297 | 156 | 75 | 82 | 103 | 22 | 180 | 78 | 199 | |||||||
| Western | 71 | 55 | 3 | 20 | 44 | 18 | 19 | 113 | ||||||||
| Windsor | 61 | 42 | 20 | 26 | 74 | 19 | ||||||||||
| York | 20 | 12 | 9 | |||||||||||||
| TOTAL | 699 | 2,257 | 3,145 | 591 | 1,593 | 593 | 594 | 292 | 714 | 272 | 2,150 | 216 | 511 | 914 | 1,771 |
Undergraduate Degrees Awarded (UD)
| Discipline | 2011 | 2012 | 2013 | 2014 | 2015 |
|---|---|---|---|---|---|
| Biosystems | 153 | 152 | 194 | 211 | 235 |
| Chemical | 1,161 | 1,278 | 1,307 | 1,292 | 1,297 |
| Civil | 2,235 | 2,325 | 2,751 | 2,688 | 2,772 |
| Computer | 568 | 630 | 686 | 573 | 713 |
| Electrical | 2,041 | 2,055 | 2,137 | 2,202 | 2,375 |
| EngineeringPhysics | 453 | 515 | 548 | 532 | 599 |
| Environmental | 229 | 258 | 300 | 360 | 337 |
| Geological | 128 | 121 | 164 | 152 | 192 |
| Industrial or Manufacturing | 350 | 369 | 361 | 440 | 527 |
| Materials or Metallurgical | 211 | 207 | 216 | 213 | 235 |
| Mechanical | 2,966 | 3,153 | 3,255 | 3,338 | 3,634 |
| Mining or Mineral | 222 | 237 | 220 | 280 | 307 |
| Software | 366 | 413 | 434 | 547 | 632 |
| Other | 678 | 669 | 790 | 908 | 702 |
| Year One/Two Common Year | 140 | 20 | |||
| TOTAL | 11,761 | 12,382 | 13,363 | 13,876 | 14,577 |
| Discipline | 2011 | 2012 | 2013 | 2014 | 2015 |
|---|---|---|---|---|---|
| Biosystems | 153 | 76 | 87 | 101 | 97 |
| Chemical | 399 | 444 | 427 | 402 | 442 |
| Civil | 491 | 500 | 605 | 597 | 644 |
| Computer | 57 | 69 | 71 | 59 | 67 |
| Electrical | 248 | 259 | 283 | 330 | 335 |
| Engineering Physics | 86 | 76 | 92 | 93 | 115 |
| Environmental | 95 | 116 | 121 | 147 | 138 |
| Geological | 42 | 44 | 58 | 57 | 71 |
| Industrial or Manufacturing | 89 | 94 | 73 | 125 | 139 |
| Materials or Metallurgical | 51 | 58 | 43 | 53 | 51 |
| Mechanical | 282 | 324 | 344 | 357 | 391 |
| Mining or Mineral | 46 | 35 | 38 | 44 | 64 |
| Software | 42 | 39 | 43 | 57 | 57 |
| Other | 150 | 101 | 162 | 182 | 129 |
| Year One/Two Common Year | 33 | 1 | |||
| TOTAL | 2,231 | 2,235 | 2,447 | 2,637 | 2,741 |
| Province | 2011 | 2012 | 2013 | 2014 | 2015 |
|---|---|---|---|---|---|
| AB | 1,298 | 1,246 | 1,282 | 1,346 | 1,373 |
| BC | 1,126 | 1,161 | 1,278 | 1,324 | 1,519 |
| MB | 197 | 172 | 188 | 219 | 218 |
| NB | 240 | 270 | 320 | 308 | 307 |
| NL | 151 | 166 | 270 | 194 | 196 |
| NS | 469 | 397 | 477 | 722 | 338 |
| ON | 5,075 | 5,508 | 5,927 | 5,996 | 6,465 |
| QC | 2,850 | 3,043 | 3,202 | 3,370 | 3,676 |
| SK | 355 | 419 | 419 | 397 | 485 |
| TOTAL | 11,761 | 12,382 | 13,363 | 13,876 | 14,577 |
| Province | 2011 | 2012 | 2013 | 2014 | 2015 |
|---|---|---|---|---|---|
| AB | 90 | 95 | 107 | 122 | 114 |
| BC | 91 | 110 | 109 | 140 | 197 |
| MB | 28 | 20 | 14 | 34 | 44 |
| NB | 38 | 45 | 57 | 70 | 71 |
| NL | 14 | 4 | 16 | 30 | 22 |
| NS | 64 | 44 | 65 | 108 | 56 |
| ON | 411 | 577 | 585 | 640 | 816 |
| QC | 271 | 327 | 353 | 424 | 421 |
| SK | 40 | 34 | 63 | 63 | 84 |
| TOTAL | 1,047 | 1,256 | 1,369 | 1,631 | 1,825 |
| Discipline | AB | BC | MB | NB | NL | NS | ON | QC | SK |
|---|---|---|---|---|---|---|---|---|---|
| Biosystems | 33 | 14 | 138 | 40 | 10 | ||||
| Chemical | 203 | 62 | 52 | 39 | 710 | 173 | 58 | ||
| Civil | 250 | 216 | 51 | 89 | 39 | 40 | 1,057 | 953 | 77 |
| Computer | 39 | 136 | 11 | 6 | 9 | 1 | 342 | 140 | 29 |
| Electrical | 267 | 256 | 44 | 48 | 29 | 57 | 1,050 | 592 | 32 |
| Engineering Physics | 21 | 168 | 330 | 67 | 13 | ||||
| Environmental | 55 | 24 | 193 | 26 | 39 | ||||
| Geological | 38 | 6 | 70 | 44 | 34 | ||||
| Industrial or Manufacturing | 44 | 173 | 268 | 42 | |||||
| Materials or Metallurgical | 42 | 48 | 8 | 81 | 56 | ||||
| Mechanical | 354 | 396 | 98 | 68 | 75 | 73 | 1,572 | 918 | 80 |
| Mining or Mineral | 38 | 45 | 32 | 112 | 80 | ||||
| Software | 41 | 26 | 6 | 283 | 267 | 9 | |||
| Other | 118 | 40 | 32 | 44 | 354 | 52 | 62 | ||
| Year One/Two Common Year | |||||||||
| TOTAL | 1,373 | 1,519 | 218 | 307 | 196 | 318 | 6,465 | 3,676 | 485 |
| Discipline | AB | BC | MB | NB | NL | NS | ON | QC | SK |
|---|---|---|---|---|---|---|---|---|---|
| Biosystems | 18 | 10 | 54 | 13 | 2 | ||||
| Chemical | 75 | 18 | 13 | 9 | 237 | 75 | 15 | ||
| Civil | 82 | 50 | 13 | 19 | 17 | 3 | 224 | 219 | 17 |
| Computer | 5 | 17 | 2 | 2 | 28 | 10 | 3 | ||
| Electrical | 40 | 37 | 8 | 5 | 2 | 10 | 156 | 72 | 5 |
| Engineering Physics | 2 | 33 | 66 | 12 | 2 | ||||
| Environmental | 20 | 16 | 72 | 16 | 14 | ||||
| Geological | 14 | 5 | 30 | 12 | 10 | ||||
| Industrial or Manufacturing | 11 | 51 | 72 | 5 | |||||
| Materials or Metallurgical | 13 | 10 | 2 | 17 | 9 | ||||
| Mechanical | 54 | 36 | 9 | 5 | 13 | 9 | 162 | 97 | 6 |
| MiningorMineral | 11 | 3 | 3 | 23 | 24 | ||||
| Software | 10 | 1 | 26 | 19 | 1 | ||||
| Other | 27 | 8 | 4 | 10 | 69 | 6 | 5 | ||
| YearOne/Two Common Year | 1 | ||||||||
| TOTAL | 319 | 265 | 42 | 53 | 42 | 64 | 1,215 | 656 | 85 |
| Institution | 2011 | 2012 | 2013 | 2014 | 2015 |
|---|---|---|---|---|---|
| Acadia | 68 | ||||
| Alberta | 836 | 805 | 760 | 737 | 792 |
| BCIT | 36 | 41 | 52 | 54 | 71 |
| Calgary | 462 | 441 | 522 | 609 | 581 |
| Carleton | 395 | 401 | 427 | 453 | 530 |
| Concordia | 350 | 402 | 462 | 458 | 491 |
| Conestoga | 9 | 11 | 11 | 30 | 26 |
| Dal | 469 | 397 | 477 | 582 | 318 |
| ETS | 724 | 681 | 828 | 788 | 898 |
| Guelph | 95 | 87 | 104 | 220 | 212 |
| Lakehead | 223 | 282 | 302 | 283 | 298 |
| Laurentian | 118 | 132 | 249 | 83 | 78 |
| Laval | 347 | 327 | 300 | 300 | 441 |
| Manitoba | 197 | 172 | 188 | 219 | 218 |
| McGill | 456 | 513 | 487 | 546 | 574 |
| McMaster | 582 | 583 | 590 | 588 | 653 |
| Moncton | 30 | 45 | 67 | 71 | 49 |
| MUN | 151 | 166 | 270 | 194 | 196 |
| NSAC | 72 | 20 | |||
| Ottawa | 252 | 254 | 286 | 363 | 374 |
| Polytechnique | 583 | 659 | 686 | 790 | 780 |
| Queen's | 507 | 620 | 641 | 594 | 595 |
| Regina | 104 | 128 | 123 | 158 | 160 |
| RMC | 77 | 72 | 93 | 0 | 89 |
| Ryerson | 409 | 442 | 514 | 557 | 567 |
| Saskatchewan | 251 | 291 | 296 | 239 | 325 |
| SFU | 94 | 112 | 142 | 157 | 189 |
| Sherbrooke | 284 | 291 | 279 | 276 | 286 |
| SMU | 0 | ||||
| Toronto | 893 | 962 | 960 | 938 | 1,035 |
| UBC | 723 | 716 | 764 | 758 | 889 |
| UBCO | 103 | 118 | 142 | 145 | 151 |
| UNB | 210 | 225 | 253 | 237 | 258 |
| UNBC | 19 | 14 | 14 | 25 | 28 |
| UOIT | 158 | 196 | 228 | 239 | 262 |
| UQAC | 44 | 42 | 65 | 71 | 72 |
| UQAM | 4 | 9 | 9 | 6 | |
| UQAR | 15 | 14 | 16 | 16 | 16 |
| UQAT | 18 | 11 | 7 | 10 | 14 |
| UQO | 1 | 35 | 7 | 5 | 5 |
| UQTR | 24 | 59 | 56 | 104 | 99 |
| UVic | 151 | 160 | 164 | 185 | 191 |
| Waterloo | 950 | 990 | 1,082 | 1,113 | 1,194 |
| Western | 208 | 232 | 249 | 291 | 305 |
| Windsor | 184 | 222 | 191 | 221 | 218 |
| York | 15 | 22 | 23 | 29 | |
| TOTAL | 11,761 | 12,382 | 13,363 | 13,876 | 14,577 |
| Institution | 2011 | 2012 | 2013 | 2014 | 2015 |
|---|---|---|---|---|---|
| Acadia | 16 | ||||
| Alberta | 186 | 150 | 159 | 141 | 176 |
| BCIT | 2 | 1 | 1 | 1 | 2 |
| Calgary | 116 | 109 | 131 | 136 | 143 |
| Carleton | 54 | 69 | 74 | 74 | 94 |
| Concordia | 51 | 63 | 88 | 96 | 92 |
| Conestoga | 0 | 1 | 1 | 5 | 1 |
| Dal | 108 | 80 | 101 | 125 | 63 |
| ETS | 68 | 54 | 90 | 65 | 83 |
| Guelph | 22 | 35 | 30 | 58 | 49 |
| Lakehead | 22 | 20 | 28 | 30 | 31 |
| Laurentian | 24 | 27 | 33 | 16 | 8 |
| Laval | 60 | 61 | 49 | 49 | 90 |
| Manitoba | 27 | 22 | 29 | 52 | 42 |
| McGill | 91 | 112 | 75 | 134 | 127 |
| McMaster | 98 | 100 | 104 | 111 | 101 |
| Moncton | 0 | 8 | 8 | 20 | 10 |
| MUN | 33 | 28 | 77 | 44 | 42 |
| NSAC | 17 | 1 | |||
| Ottawa | 44 | 40 | 57 | 70 | 82 |
| Polytechnique | 127 | 157 | 148 | 168 | 175 |
| Queen's | 120 | 154 | 170 | 159 | 170 |
| Regina | 34 | 29 | 23 | 36 | 22 |
| RMC | 14 | 4 | 11 | 0 | 9 |
| Ryerson | 54 | 80 | 92 | 112 | 112 |
| Saskatchewan | 42 | 65 | 69 | 47 | 63 |
| SFU | 14 | 13 | 12 | 21 | 37 |
| Sherbrooke | 51 | 35 | 46 | 40 | 46 |
| SMU | 0 | ||||
| Toronto | 175 | 227 | 207 | 237 | 236 |
| UBC | 152 | 135 | 128 | 141 | 185 |
| UBCO | 19 | 13 | 11 | 20 | 21 |
| UNB | 45 | 43 | 37 | 45 | 43 |
| UNBC | 10 | 7 | 8 | 10 | 10 |
| UOIT | 12 | 21 | 21 | 17 | 16 |
| UQAC | 2 | 6 | 8 | 10 | 5 |
| UQAM | 0 | 0 | 0 | 0 | |
| UQAR | 1 | 1 | 0 | 3 | 2 |
| UQAT | 1 | 1 | 2 | 1 | 3 |
| UQO | 0 | 4 | 2 | 0 | 0 |
| UQTR | 2 | 2 | 10 | 27 | 33 |
| UVic | 11 | 15 | 12 | 17 | 10 |
| Waterloo | 162 | 156 | 218 | 189 | 201 |
| Western | 48 | 49 | 48 | 48 | 64 |
| Windsor | 23 | 33 | 29 | 26 | 38 |
| York | 4 | 5 | 3 | 3 | |
| TOTAL | 2,129 | 2,235 | 2,447 | 2,637 | 2,741 |
| Institution |
Biosystems
|
Chemical
|
Civil
|
Computer
|
Electrical
|
Engineering Physics
|
Environmental
|
Geological
|
Industrial or Manufacturing
|
Materials or Metallurgical
|
Mechanical
|
Mining or Mineral
|
Software
|
Other
|
|
|---|---|---|---|---|---|---|---|---|---|---|---|---|---|---|---|
| Alberta | 122 | 163 | 39 | 123 | 21 | 42 | 191 | 38 | 53 | ||||||
| BCIT | 25 | 15 | 31 | ||||||||||||
| Calgary | 81 | 87 | 144 | 163 | 41 | 65 | |||||||||
| Carleton | 17 | 125 | 24 | 104 | 8 | 61 | 88 | 21 | 82 | ||||||
| Concordia | 172 | 19 | 46 | 43 | 158 | 53 | |||||||||
| Conestoga | 6 | 20 | |||||||||||||
| Dal | 39 | 40 | 1 | 57 | 24 | 44 | 8 | 73 | 32 | ||||||
| ETS | 277 | 216 | 75 | 232 | 98 | ||||||||||
| Guelph | 50 | 21 | 70 | 71 | |||||||||||
| Lakehead | 31 | 148 | 40 | 72 | 7 | ||||||||||
| Laurentian | 24 | 32 | 22 | ||||||||||||
| Laval | 16 | 18 | 132 | 10 | 21 | 26 | 26 | 19 | 22 | 18 | 73 | 19 | 24 | 17 | |
| Manitoba | 14 | 51 | 11 | 44 | 98 | ||||||||||
| McGill | 69 | 99 | 26 | 142 | 38 | 149 | 23 | 28 | |||||||
| McMaster | 99 | 110 | 24 | 136 | 38 | 34 | 142 | 70 | |||||||
| Moncton | 19 | 8 | 16 | 6 | |||||||||||
| MUN | 39 | 9 | 29 | 75 | 44 | ||||||||||
| NSAC | |||||||||||||||
| Ottawa | 27 | 76 | 111 | 20 | 46 | 71 | 23 | ||||||||
| Polytechnique | 24 | 49 | 172 | 49 | 65 | 41 | 23 | 73 | 150 | 38 | 64 | 32 | |||
| Queen's | 69 | 73 | 31 | 42 | 116 | 52 | 153 | 59 | |||||||
| Regina | 17 | 30 | 42 | 9 | 62 | ||||||||||
| RMC | 8 | 24 | 18 | 11 | 16 | 12 | |||||||||
| Ryerson | 44 | 40 | 96 | 27 | 101 | 70 | 114 | 75 | |||||||
| Saskatchewan | 10 | 58 | 77 | 12 | 32 | 13 | 9 | 34 | 80 | ||||||
| SFU | 113 | 76 | |||||||||||||
| Sherbrooke | 34 | 68 | 27 | 58 | 99 | ||||||||||
| Toronto | 94 | 136 | 267 | 168 | 84 | 47 | 208 | 31 | |||||||
| UBC | 33 | 62 | 131 | 116 | 162 | 55 | 27 | 38 | 48 | 132 | 45 | 40 | |||
| UBCO | 60 | 16 | 75 | ||||||||||||
| UNB | 52 | 70 | 6 | 40 | 6 | 52 | 6 | 26 | |||||||
| UNBC | 28 | ||||||||||||||
| UOIT | 62 | 4 | 135 | 16 | 45 | ||||||||||
| UQAC | 33 | 4 | 9 | 2 | 24 | ||||||||||
| UQAR | 5 | 8 | 3 | ||||||||||||
| UQAT | 8 | 6 | |||||||||||||
| UQO | 5 | ||||||||||||||
| UQTR | 3 | 22 | 55 | 19 | |||||||||||
| UVic | 20 | 63 | 82 | 26 | |||||||||||
| Waterloo | 225 | 101 | 146 | 160 | 49 | 18 | 272 | 103 | 120 | ||||||
| Western | 44 | 75 | 9 | 31 | 90 | 43 | 13 | ||||||||
| Windsor | 58 | 50 | 13 | 15 | 82 | ||||||||||
| York | 16 | 6 | 7 | ||||||||||||
| TOTAL | 235 | 1,297 | 2,772 | 713 | 2,375 | 599 | 337 | 192 | 527 | 235 | 3,634 | 307 | 632 | 702 |
| Institution |
Biosystems
|
Chemical
|
Civil
|
Computer
|
Electrical
|
Engineering Physics
|
Environmental
|
Geological
|
Industrial or Manufacturing
|
Materials or Metallurgical
|
Mechanical
|
Mining or Mineral
|
Software
|
Other
|
|
|---|---|---|---|---|---|---|---|---|---|---|---|---|---|---|---|
| Alberta | 46 | 57 | 5 | 13 | 2 | 13 | 24 | 11 | 5 | ||||||
| BCIT | 1 | 1 | |||||||||||||
| Calgary | 29 | 25 | 27 | 30 | 10 | 22 | |||||||||
| Carleton | 6 | 26 | 3 | 18 | 2 | 19 | 7 | 1 | 12 | ||||||
| Concordia | 47 | 1 | 7 | 13 | 19 | 5 | |||||||||
| Conestoga | 1 | ||||||||||||||
| Dal | 9 | 3 | 10 | 16 | 11 | 2 | 9 | 3 | |||||||
| ETS | 53 | 20 | 2 | 5 | 3 | ||||||||||
| Guelph | 18 | 26 | 5 | ||||||||||||
| Lakehead | 10 | 18 | 3 | ||||||||||||
| Laurentian | 5 | 3 | |||||||||||||
| Laval | 4 | 9 | 24 | 1 | 1 | 8 | 16 | 4 | 6 | 3 | 7 | 1 | 4 | 2 | |
| Manitoba | 10 | 13 | 2 | 8 | 9 | ||||||||||
| McGill | 26 | 34 | 4 | 24 | 6 | 28 | 2 | 3 | |||||||
| McMaster | 30 | 16 | 1 | 24 | 4 | 9 | 10 | 7 | |||||||
| Moncton | 5 | 2 | 2 | 1 | |||||||||||
| MUN | 17 | 2 | 13 | 10 | |||||||||||
| NSAC | |||||||||||||||
| Ottawa | 14 | 29 | 24 | 1 | 5 | 7 | 2 | ||||||||
| Polytechnique | 9 | 23 | 47 | 2 | 9 | 4 | 8 | 24 | 21 | 21 | 4 | 3 | |||
| Queen's | 33 | 26 | 7 | 4 | 26 | 25 | 36 | 13 | |||||||
| Regina | 2 | 9 | 5 | 1 | 5 | ||||||||||
| RMC | 1 | 1 | 3 | 1 | 1 | 2 | |||||||||
| Ryerson | 16 | 16 | 25 | 12 | 26 | 6 | 11 | ||||||||
| Saskatchewan | 2 | 15 | 17 | 1 | 5 | 2 | 5 | 10 | 6 | ||||||
| SFU | 30 | 7 | |||||||||||||
| Sherbrooke | 16 | 10 | 1 | 6 | 13 | ||||||||||
| Toronto | 40 | 41 | 48 | 34 | 23 | 8 | 35 | 7 | |||||||
| UBC | 18 | 18 | 34 | 17 | 31 | 3 | 10 | 14 | 10 | 19 | 3 | 8 | |||
| UBCO | 15 | 3 | 3 | ||||||||||||
| UNB | 13 | 14 | 2 | 3 | 5 | 3 | 3 | ||||||||
| UNBC | 10 | ||||||||||||||
| UOIT | 4 | 4 | 1 | 7 | |||||||||||
| UQAC | 4 | 1 | |||||||||||||
| UQAR | 1 | 1 | |||||||||||||
| UQAT | 1 | 2 | |||||||||||||
| UQO | |||||||||||||||
| UQTR | 1 | 4 | 27 | 1 | |||||||||||
| UVic | 2 | 7 | 1 | ||||||||||||
| Waterloo | 56 | 20 | 11 | 20 | 22 | 5 | 27 | 10 | 30 | ||||||
| Western | 17 | 18 | 6 | 12 | 5 | 6 | |||||||||
| Windsor | 9 | 14 | 5 | 2 | 8 | ||||||||||
| York | 2 | 1 | |||||||||||||
| TOTAL | 97 | 442 | 644 | 67 | 335 | 115 | 138 | 71 | 139 | 51 | 391 | 64 | 57 | 129 |
Post-graduate Enrolment (G)
| Year | 2011 | 2012 | 2013 | 2014 | 2015 |
|---|---|---|---|---|---|
| Cdn Male | 5,034 | 4,818 | 4,654 | 4,001 | 4,259 |
| Cdn Female | 1,431 | 1,385 | 1,396 | 1,221 | 1,334 |
| Visa Male | 3,663 | 4,252 | 4,454 | 4,945 | 5,569 |
| Visa Female | 1,083 | 1,298 | 1,348 | 1,679 | 1,877 |
| TOTAL | 11,211 | 11,753 | 11,852 | 11,845 | 13,039 |
| Year | 2011 | 2012 | 2013 | 2014 | 2015 |
|---|---|---|---|---|---|
| Cdn Male | 3,287 | 3,390 | 3,336 | 3,065 | 3,063 |
| Cdn Female | 876 | 966 | 1,089 | 1,000 | 989 |
| Visa Male | 2,802 | 3,227 | 3,287 | 3,615 | 4,018 |
| Visa Female | 763 | 894 | 997 | 1,076 | 1,149 |
| TOTAL | 7,728 | 8,477 | 8,709 | 8,756 | 9,219 |
| Year | 2011 | 2012 | 2013 | 2014 | 2015 |
|---|---|---|---|---|---|
| Cdn Male | 1,991 | 1,978 | 1,790 | 1,290 | 1,190 |
| Cdn Female | 444 | 554 | 498 | 395 | 324 |
| Visa Male | 202 | 132 | 204 | 203 | 228 |
| Visa Female | 42 | 40 | 47 | 64 | 70 |
| Total | 2,679 | 2,704 | 2,539 | 1,952 | 1,812 |
| Year | 2011 | 2012 | 2013 | 2014 | 2015 |
|---|---|---|---|---|---|
| Cdn Male | 373 | 311 | 285 | 239 | 255 |
| Cdn Female | 69 | 51 | 59 | 52 | 56 |
| Visa Male | 45 | 36 | 39 | 34 | 34 |
| Visa Female | 6 | 6 | 2 | 9 | 6 |
| Total | 493 | 404 | 385 | 334 | 351 |
| Discipline | 2011 | 2012 | 2013 | 2014 | 2015 |
|---|---|---|---|---|---|
| Biosystems | 442 | 382 | 378 | 415 | 431 |
| Chemical | 1,082 | 1,099 | 1,026 | 910 | 989 |
| Civil | 2,068 | 2,060 | 1,875 | 1,843 | 2,064 |
| Computer | 337 | 322 | 439 | 337 | 402 |
| Electrical | 3,014 | 3,432 | 3,420 | 3,412 | 3,645 |
| Engineering Physics | 167 | 202 | 184 | 202 | 203 |
| Environmental | 270 | 268 | 296 | 352 | 360 |
| Geological | 20 | 19 | 18 | 16 | 16 |
| Industrial or Manufacturing | 403 | 392 | 427 | 449 | 415 |
| Materials or Metallurgical | 224 | 246 | 261 | 242 | 239 |
| Mechanical | 1,958 | 2,083 | 2,110 | 2,148 | 2,517 |
| Mining or Mineral | 160 | 160 | 148 | 188 | 211 |
| Software | 177 | 203 | 284 | 297 | 344 |
| Other | 1,805 | 1,826 | 1,856 | 1,836 | 1,878 |
| TOTAL | 12,127 | 12,694 | 12,722 | 12,646 | 13,714 |
| Discipline | 2011 | 2012 | 2013 | 2014 | 2015 |
|---|---|---|---|---|---|
| Biosystems | 400 | 325 | 429 | 448 | 483 |
| Chemical | 870 | 1,076 | 1,007 | 958 | 966 |
| Civil | 1,191 | 1,282 | 1,292 | 1,334 | 1,423 |
| Computer | 157 | 156 | 145 | 149 | 199 |
| Electrical | 2,230 | 2,445 | 2,354 | 2,406 | 2,423 |
| Engineering Physics | 174 | 211 | 219 | 227 | 247 |
| Environmental | 97 | 99 | 136 | 116 | 126 |
| Geological | 7 | 8 | 11 | 6 | 2 |
| Industrial or Manufacturing | 224 | 176 | 185 | 185 | 214 |
| Materials or Metallurgical | 273 | 375 | 359 | 366 | 362 |
| Mechanical | 1,340 | 1,495 | 1,631 | 1,608 | 1,661 |
| Mining or Mineral | 102 | 101 | 100 | 119 | 124 |
| Software | 18 | 18 | 27 | 51 | 17 |
| Other | 894 | 863 | 958 | 928 | 1,134 |
| TOTAL | 7,977 | 8,630 | 8,853 | 8,901 | 9,381 |
| Discipline | 2011 | 2012 | 2013 | 2014 | 2015 |
|---|---|---|---|---|---|
| Biosystems | 191 | 169 | 152 | 164 | 171 |
| Chemical | 337 | 383 | 358 | 321 | 370 |
| Civil | 570 | 543 | 505 | 489 | 566 |
| Computer | 62 | 58 | 56 | 68 | 83 |
| Electrical | 539 | 671 | 721 | 789 | 840 |
| Engineering Physics | 41 | 43 | 42 | 45 | 44 |
| Environmental | 91 | 110 | 134 | 162 | 162 |
| Geological | 8 | 9 | 7 | 5 | 4 |
| Industrial or Manufacturing | 103 | 113 | 114 | 112 | 98 |
| Materials or Metallurgical | 74 | 73 | 77 | 68 | 66 |
| Mechanical | 250 | 267 | 276 | 328 | 383 |
| Mining or Mineral | 48 | 42 | 35 | 47 | 53 |
| Software | 28 | 36 | 54 | 66 | 86 |
| Other | 347 | 370 | 401 | 412 | 426 |
| TOTAL | 2,689 | 2,887 | 2,932 | 3,076 | 3,352 |
| Discipline | 2011 | 2012 | 2013 | 2014 | 2015 |
|---|---|---|---|---|---|
| Biosystems | 153 | 122 | 160 | 161 | 174 |
| Chemical | 278 | 346 | 351 | 327 | 316 |
| Civil | 264 | 309 | 317 | 337 | 350 |
| Computer | 44 | 42 | 36 | 33 | 46 |
| Electrical | 370 | 407 | 427 | 452 | 456 |
| Engineering Physics | 25 | 41 | 47 | 52 | 55 |
| Environmental | 25 | 34 | 51 | 44 | 52 |
| Geological | 2 | 2 | 3 | 2 | 1 |
| Industrial or Manufacturing | 37 | 39 | 39 | 42 | 53 |
| Materials or Metallurgical | 60 | 99 | 99 | 106 | 121 |
| Mechanical | 218 | 253 | 347 | 278 | 264 |
| Mining or Mineral | 26 | 26 | 26 | 36 | 36 |
| Software | 3 | 2 | 4 | 9 | 2 |
| Other | 175 | 162 | 204 | 226 | 250 |
| TOTAL | 1,680 | 1,884 | 2,111 | 2,105 | 2,176 |
| Discipline | 2011 | 2012 | 2013 | 2014 | 2015 |
|---|---|---|---|---|---|
| Biosystems | 125 | 114 | 130 | 117 | 127 |
| Chemical | 446 | 523 | 398 | 492 | 533 |
| Civil | 644 | 681 | 701 | 708 | 849 |
| Computer | 156 | 164 | 203 | 184 | 234 |
| Electrical | 1,498 | 1,892 | 1,904 | 2,200 | 2,390 |
| Engineering Physics | 52 | 61 | 67 | 61 | 73 |
| Environmental | 104 | 118 | 132 | 185 | 185 |
| Geological | 1 | 3 | 6 | 5 | 4 |
| Industrial or Manufacturing | 183 | 170 | 218 | 247 | 236 |
| Materials or Metallurgical | 95 | 107 | 124 | 109 | 103 |
| Mechanical | 635 | 816 | 913 | 1,056 | 1,352 |
| Mining or Mineral | 68 | 71 | 73 | 85 | 99 |
| Software | 71 | 95 | 184 | 231 | 258 |
| Other | 747 | 803 | 858 | 1,056 | 1,132 |
| TOTAL | 4,825 | 5,618 | 5,911 | 6,736 | 7,575 |
| Discipline | 2011 | 2012 | 2013 | 2014 | 2015 |
|---|---|---|---|---|---|
| Biosystems | 124 | 101 | 161 | 175 | 188 |
| Chemical | 444 | 555 | 481 | 523 | 552 |
| Civil | 504 | 583 | 613 | 678 | 738 |
| Computer | 68 | 74 | 80 | 76 | 113 |
| Electrical | 1,030 | 1,194 | 1,209 | 1,328 | 1,422 |
| Engineering Physics | 54 | 83 | 98 | 108 | 127 |
| Environmental | 37 | 46 | 61 | 63 | 62 |
| Geological | 3 | 2 | 5 | 1 | 2 |
| Industrial or Manufacturing | 96 | 86 | 100 | 98 | 113 |
| Materials or Metallurgical | 160 | 219 | 199 | 218 | 229 |
| Mechanical | 636 | 734 | 786 | 872 | 955 |
| Mining or Mineral | 51 | 48 | 49 | 61 | 65 |
| Software | 8 | 7 | 11 | 17 | 5 |
| Other | 377 | 408 | 450 | 494 | 641 |
| TOTAL | 3,592 | 4,140 | 4,303 | 4,712 | 5,212 |
| Province | 2011 | 2012 | 2013 | 2014 | 2015 |
|---|---|---|---|---|---|
| AB | 2,013 | 1,578 | 1,307 | 1,071 | 1,214 |
| BC | 892 | 851 | 848 | 857 | 1,065 |
| MB | 187 | 214 | 228 | 248 | 245 |
| NB | 187 | 180 | 171 | 133 | 151 |
| NL | 231 | 277 | 267 | 298 | 300 |
| NS | 356 | 335 | 418 | 389 | 367 |
| ON | 4,506 | 4,814 | 5,343 | 5,296 | 5,503 |
| QC | 3,465 | 4,123 | 3,799 | 4,023 | 4,479 |
| SK | 290 | 323 | 344 | 332 | 391 |
| TOTAL | 12,127 | 12,695 | 12,725 | 12,647 | 13,715 |
| Province | 2011 | 2012 | 2013 | 2014 | 2015 |
|---|---|---|---|---|---|
| AB | 1,241 | 1,233 | 1,141 | 1,081 | 1,101 |
| BC | 818 | 885 | 895 | 884 | 1,039 |
| MB | 205 | 213 | 214 | 214 | 240 |
| NB | 106 | 114 | 111 | 86 | 76 |
| NL | 86 | 100 | 127 | 151 | 165 |
| NS | 144 | 91 | 113 | 123 | 144 |
| ON | 2,965 | 3,103 | 3,294 | 3,394 | 3,423 |
| QC | 2,218 | 2,701 | 2,751 | 2,768 | 2,858 |
| SK | 197 | 190 | 206 | 200 | 337 |
| TOTAL | 7,980 | 8,630 | 8,852 | 8,901 | 9,383 |
| Province | 2011 | 2012 | 2013 | 2014 | 2015 |
|---|---|---|---|---|---|
| AB | 439 | 416 | 361 | 325 | 360 |
| BC | 220 | 196 | 194 | 197 | 243 |
| MB | 40 | 49 | 57 | 67 | 61 |
| NB | 35 | 34 | 35 | 24 | 41 |
| NL | 50 | 69 | 72 | 69 | 63 |
| NS | 45 | 44 | 61 | 62 | 78 |
| ON | 1,008 | 1,077 | 1,212 | 1,302 | 1,378 |
| QC | 757 | 910 | 847 | 943 | 1,029 |
| SK | 93 | 91 | 95 | 87 | 100 |
| TOTAL | 2,687 | 2,886 | 2,934 | 3,076 | 3,353 |
| Province | 2011 | 2012 | 2013 | 2014 | 2015 |
|---|---|---|---|---|---|
| AB | 260 | 269 | 332 | 276 | 255 |
| BC | 165 | 183 | 188 | 190 | 200 |
| MB | 34 | 39 | 42 | 44 | 50 |
| NB | 27 | 31 | 34 | 21 | 17 |
| NL | 14 | 16 | 23 | 32 | 34 |
| NS | 28 | 21 | 29 | 28 | 33 |
| ON | 624 | 674 | 743 | 766 | 792 |
| QC | 486 | 601 | 667 | 688 | 714 |
| SK | 42 | 48 | 53 | 60 | 83 |
| TOTAL | 1,680 | 1,882 | 2,112 | 2,104 | 2,177 |
| Province | 2011 | 2012 | 2013 | 2014 | 2015 |
|---|---|---|---|---|---|
| AB | 906 | 801 | 610 | 622 | 656 |
| BC | 399 | 427 | 459 | 502 | 665 |
| MB | 88 | 109 | 123 | 135 | 134 |
| NB | 93 | 88 | 87 | 68 | 60 |
| NL | 163 | 217 | 205 | 245 | 264 |
| NS | 225 | 247 | 294 | 268 | 255 |
| ON | 1,367 | 1,759 | 1,983 | 2,474 | 2,737 |
| QC | 1,401 | 1,756 | 1,916 | 2,183 | 2,538 |
| SK | 183 | 212 | 236 | 241 | 267 |
| TOTAL | 4,825 | 5,617 | 5,912 | 6,737 | 7,576 |
| Province | 2011 | 2012 | 2013 | 2014 | 2015 |
|---|---|---|---|---|---|
| AB | 620 | 696 | 485 | 719 | 721 |
| BC | 477 | 522 | 534 | 536 | 643 |
| MB | 100 | 114 | 123 | 135 | 148 |
| NB | 65 | 74 | 77 | 57 | 27 |
| NL | 45 | 56 | 80 | 105 | 125 |
| NS | 57 | 40 | 48 | 64 | 67 |
| ON | 1,050 | 1,163 | 1,358 | 1,454 | 1,586 |
| QC | 1,061 | 1,348 | 1,452 | 1,503 | 1,710 |
| SK | 116 | 127 | 143 | 139 | 187 |
| TOTAL | 3,591 | 4,139 | 4,300 | 4,712 | 5,213 |
| Discipline | AB | BC | MB | NB | NL | NS | ON | QC | SK | Total |
|---|---|---|---|---|---|---|---|---|---|---|
| Biosystems | 76 | 185 | 63 | 2 | 43 | 340 | 118 | 87 | 914 | |
| Chemical | 539 | 43 | 28 | 899 | 405 | 41 | 1,956 | |||
| Civil | 414 | 413 | 108 | 35 | 43 | 56 | 1,282 | 1,137 | 3,487 | |
| Computer | 71 | 1 | 70 | 246 | 159 | 55 | 601 | |||
| Electrical | 356 | 663 | 172 | 53 | 52 | 84 | 2,822 | 1,765 | 100 | 6,068 |
| Engineering Physics | 104 | 113 | 15 | 77 | 141 | 451 | ||||
| Environmental | 17 | 25 | 15 | 207 | 145 | 76 | 486 | |||
| Geological | 3 | 15 | 18 | |||||||
| Industrial or Manufacturing | 57 | 32 | 72 | 415 | 52 | 629 | ||||
| Materials or Metallurgical | 90 | 91 | 19 | 171 | 230 | 601 | ||||
| Mechanical | 404 | 535 | 86 | 36 | 52 | 48 | 1,824 | 1,093 | 100 | 4,179 |
| Mining or Mineral | 95 | 82 | 7 | 78 | 73 | 335 | ||||
| Software | 40 | 310 | 12 | 361 | ||||||
| Other | 167 | 57 | 223 | 163 | 853 | 1,345 | 204 | 3,012 |
| Discipline | AB | BC | MB | NB | NL | NS | ON | QC | SK | Total |
|---|---|---|---|---|---|---|---|---|---|---|
| Biosystems | 33 | 57 | 20 | 1 | 16 | 141 | 52 | 26 | 345 | |
| Chemical | 164 | 18 | 6 | 335 | 146 | 17 | 686 | |||
| Civil | 135 | 90 | 30 | 8 | 11 | 23 | 329 | 290 | 916 | |
| Computer | 15 | 0 | 12 | 59 | 32 | 11 | 129 | |||
| Electrical | 85 | 132 | 41 | 12 | 13 | 13 | 611 | 373 | 17 | 1,297 |
| Engineering Physics | 25 | 27 | 2 | 13 | 32 | 99 | ||||
| Environmental | 6 | 15 | 6 | 94 | 59 | 35 | 214 | |||
| Geological | 1 | 4 | 5 | |||||||
| Industrial or Manufacturing | 10 | 10 | 12 | 109 | 11 | 151 | ||||
| Materials or Metallurgical | 26 | 32 | 4 | 47 | 77 | 187 | ||||
| Mechanical | 72 | 70 | 10 | 6 | 5 | 7 | 306 | 150 | 20 | 647 |
| Mining or Mineral | 19 | 26 | 1 | 19 | 24 | 89 | ||||
| Software | 8 | 78 | 2 | 88 | ||||||
| Other | 41 | 13 | 43 | 21 | 192 | 322 | 44 | 677 |
| Institution | 2011 | 2012 | 2013 | 2014 | 2015 |
|---|---|---|---|---|---|
| Alberta | 1,541 | 1,495 | 1,493 | 1,344 | 1,317 |
| Calgary | 1,519 | 1,223 | 898 | 788 | 998 |
| Carleton | 572 | 669 | 717 | 727 | 757 |
| Concordia | 1,517 | 1,677 | 1,752 | 1,879 | 2,102 |
| Dal | 491 | 415 | 520 | 487 | 489 |
| ETS | 804 | 1,161 | 918 | 1,116 | 1,249 |
| Guelph | 125 | 132 | 128 | 155 | 161 |
| Lakehead | 46 | 48 | 41 | 56 | 74 |
| Laurentian | 38 | 55 | 31 | 50 | 37 |
| Laval | 490 | 487 | 531 | 531 | 494 |
| Manitoba | 378 | 414 | 429 | 452 | 477 |
| McGill | 579 | 1,081 | 969 | 842 | 846 |
| McMaster | 643 | 581 | 706 | 697 | 736 |
| Moncton | 13 | 15 | 15 | 10 | 18 |
| MUN | 290 | 348 | 363 | 423 | 465 |
| NSAC | |||||
| Ottawa | 466 | 608 | 810 | 918 | 904 |
| Polytechnique | 1,259 | 1,273 | 1,288 | 1,314 | 1,400 |
| Queen's | 450 | 433 | 446 | 471 | 467 |
| Regina | 173 | 170 | 182 | 188 | 231 |
| RMC | 112 | 96 | 88 | 92 | 95 |
| Ryerson | 582 | 718 | 707 | 551 | 584 |
| Saskatchewan | 300 | 324 | 342 | 324 | 425 |
| SFU | 211 | 207 | 190 | 194 | 181 |
| Sherbrooke | 482 | 523 | 492 | 485 | 540 |
| SMU | 2 | 7 | |||
| Toronto | 1,450 | 1,549 | 1,688 | 1,839 | 1,900 |
| UBC | 1,072 | 1,068 | 1,074 | 1,037 | 984 |
| UBCO | 130 | 140 | 142 | 164 | 549 |
| UNB | 226 | 234 | 221 | 166 | 163 |
| UOIT | 151 | 142 | 214 | 158 | 174 |
| UQAC | 134 | 117 | 147 | 94 | 211 |
| UQAM | 18 | ||||
| UQAR | 16 | 19 | 15 | 22 | 25 |
| UQAT | 47 | 38 | 23 | 28 | 29 |
| UQTR | 92 | 101 | 110 | 117 | 125 |
| UVic | 257 | 306 | 324 | 304 | 337 |
| Waterloo | 1,244 | 1,293 | 1,339 | 1,290 | 1,261 |
| Western | 566 | 556 | 574 | 582 | 708 |
| Windsor | 456 | 510 | 628 | 670 | 717 |
| York | 6 | 17 | 24 |
| Institution | 2011 | 2012 | 2013 | 2014 | 2015 |
|---|---|---|---|---|---|
| Alberta | 0 | 0 | 0 | 0 | 0 |
| Calgary | 274 | 234 | 158 | 33 | 0 |
| Carleton | 171 | 162 | 139 | 140 | 128 |
| Concordia | 104 | 100 | 87 | 107 | 136 |
| Dal | 26 | 17 | 12 | 40 | 13 |
| ETS | 450 | 331 | 364 | 387 | 365 |
| Guelph | 37 | 35 | 27 | 28 | 24 |
| Lakehead | 0 | 0 | 1 | 0 | 0 |
| Laurentian | 8 | 0 | 26 | 0 | 1 |
| Laval | 49 | 55 | 41 | 39 | 42 |
| Manitoba | 49 | 45 | 43 | 37 | 31 |
| McGill | 12 | 58 | 0 | 48 | 56 |
| McMaster | 481 | 464 | 453 | 107 | 85 |
| Moncton | 2 | 0 | 0 | 9 | 6 |
| MUN | 53 | 55 | 58 | 76 | 76 |
| NSAC | 0 | ||||
| Ottawa | 99 | 110 | 101 | 109 | 131 |
| Polytechnique | 88 | 109 | 112 | 114 | 127 |
| Queen's | 38 | 58 | 50 | 35 | 34 |
| Regina | 28 | 38 | 41 | 38 | 39 |
| RMC | 17 | 20 | 17 | 23 | 25 |
| Ryerson | 107 | 93 | 150 | 79 | 72 |
| Saskatchewan | 0 | 0 | 0 | 0 | 0 |
| SFU | 9 | 8 | 14 | 18 | 27 |
| Sherbrooke | 171 | 153 | 145 | 0 | 0 |
| SMU | 0 | 0 | |||
| Toronto | 192 | 214 | 201 | 168 | 146 |
| UBC | 36 | 33 | 26 | 105 | 105 |
| UBCO | 0 | 0 | 0 | 0 | 2 |
| UNB | 51 | 44 | 41 | 42 | 45 |
| UOIT | 32 | 50 | 63 | 61 | 72 |
| UQAC | 0 | 0 | 0 | 5 | 0 |
| UQAM | 0 | ||||
| UQAR | 0 | 0 | 2 | 0 | 1 |
| UQAT | 0 | 0 | 0 | 2 | 2 |
| UQTR | 21 | 139 | 114 | 76 | 38 |
| UVic | 0 | 0 | 0 | 0 | 0 |
| Waterloo | 397 | 405 | 375 | 304 | 278 |
| Western | 151 | 55 | 37 | 27 | 29 |
| Windsor | 15 | 19 | 23 | 28 | 23 |
| York | 2 | 3 | 4 | ||
| TOTAL | 3,167 | 3,104 | 2,924 | 2,286 | 2,163 |
| Institution | 2011 | 2012 | 2013 | 2014 | 2015 |
|---|---|---|---|---|---|
| Alberta | 359 | 365 | 438 | 378 | 347 |
| Calgary | 303 | 301 | 246 | 219 | 268 |
| Carleton | 110 | 137 | 152 | 163 | 177 |
| Concordia | 321 | 363 | 391 | 440 | 489 |
| Dal | 72 | 65 | 88 | 89 | 108 |
| ETS | 148 | 223 | 186 | 270 | 293 |
| Guelph | 29 | 29 | 30 | 43 | 49 |
| Lakehead | 5 | 10 | 4 | 9 | 14 |
| Laurentian | 7 | 9 | 3 | 10 | 8 |
| Laval | 101 | 99 | 116 | 116 | 127 |
| Manitoba | 71 | 85 | 97 | 108 | 109 |
| McGill | 128 | 235 | 206 | 194 | 197 |
| McMaster | 164 | 164 | 194 | 186 | 189 |
| Moncton | 3 | 1 | 2 | 2 | 4 |
| MUN | 61 | 79 | 89 | 97 | 98 |
| NSAC | - | ||||
| Ottawa | 104 | 135 | 203 | 252 | 245 |
| Polytechnique | 351 | 361 | 379 | 380 | 378 |
| Queen's | 112 | 97 | 100 | 104 | 104 |
| Regina | 40 | 45 | 53 | 55 | 52 |
| RMC | 25 | 17 | 17 | 15 | 15 |
| Ryerson | 99 | 117 | 115 | 117 | 133 |
| Saskatchewan | 92 | 88 | 89 | 86 | 107 |
| SFU | 41 | 40 | 41 | 45 | 46 |
| Sherbrooke | 85 | 88 | 83 | 87 | 88 |
| SMU | - | - | |||
| Toronto | 369 | 405 | 440 | 492 | 527 |
| UBC | 261 | 256 | 262 | 261 | 258 |
| UBCO | 28 | 30 | 23 | 20 | 68 |
| UNB | 52 | 59 | 56 | 34 | 44 |
| UOIT | 22 | 21 | 41 | 33 | 38 |
| UQAC | 33 | 26 | 40 | 29 | 66 |
| UQAM | 2 | ||||
| UQAR | 2 | 2 | 1 | 2 | 3 |
| UQAT | 5 | 6 | 4 | 4 | 5 |
| UQTR | 18 | 17 | 28 | 26 | 29 |
| UVic | 43 | 49 | 53 | 53 | 60 |
| Waterloo | 284 | 290 | 303 | 292 | 286 |
| Western | 116 | 137 | 146 | 152 | 190 |
| Windsor | 79 | 89 | 110 | 105 | 126 |
| York | 1 | 5 | 7 | ||
| TOTAL | 4,143 | 4,541 | 4,829 | 4,975 | 5,350 |
| Institution | 2011 | 2012 | 2013 | 2014 | 2015 |
|---|---|---|---|---|---|
| Alberta | 0 | 0 | 0 | 0 | 0 |
| Calgary | 39 | 47 | 24 | 6 | 0 |
| Carleton | 34 | 29 | 24 | 31 | 30 |
| Concordia | 22 | 19 | 13 | 18 | 23 |
| Dal | 3 | 1 | 3 | 1 | 2 |
| ETS | 77 | 67 | 80 | 90 | 80 |
| Guelph | 6 | 8 | 11 | 12 | 8 |
| Lakehead | 0 | 0 | 0 | 0 | 0 |
| Laurentian | 1 | 0 | 4 | 0 | 0 |
| Laval | 13 | 14 | 6 | 8 | 7 |
| Manitoba | 11 | 13 | 8 | 8 | 5 |
| McGill | 2 | 12 | 0 | 6 | 9 |
| McMaster | 81 | 77 | 74 | 23 | 11 |
| Moncton | 0 | 0 | 0 | 2 | 2 |
| MUN | 6 | 11 | 11 | 13 | 9 |
| NSAC | 0 | ||||
| Ottawa | 19 | 18 | 20 | 27 | 32 |
| Polytechnique | 20 | 28 | 30 | 40 | 43 |
| Queen's | 8 | 13 | 11 | 6 | 6 |
| Regina | 6 | 12 | 10 | 10 | 9 |
| RMC | 5 | 4 | 0 | 7 | 6 |
| Ryerson | 8 | 7 | 19 | 14 | 11 |
| Saskatchewan | 0 | 0 | 0 | 0 | 0 |
| SFU | 1 | 1 | 1 | 2 | 4 |
| Sherbrooke | 36 | 31 | 32 | 0 | 0 |
| SMU | 0 | 0 | |||
| Toronto | 37 | 47 | 47 | 38 | 28 |
| UBC | 11 | 10 | 8 | 28 | 30 |
| UBCO | 0 | 0 | 0 | 0 | 0 |
| UNB | 7 | 4 | 10 | 10 | 10 |
| UOIT | 4 | 9 | 12 | 8 | 11 |
| UQAC | 0 | 0 | 0 | 3 | 0 |
| UQAM | 0 | ||||
| UQAR | 0 | 0 | 1 | 0 | 0 |
| UQAT | 0 | 0 | 0 | 0 | 0 |
| UQTR | 2 | 81 | 64 | 44 | 18 |
| UVic | 0 | 0 | 0 | 0 | 0 |
| Waterloo | 77 | 83 | 70 | 56 | 53 |
| Western | 21 | 3 | 11 | 6 | 8 |
| Windsor | 2 | 2 | 2 | 2 | 2 |
| York | 1 | 2 | 1 | ||
| TOTAL | 560 | 651 | 607 | 520 | 456 |
| Institution |
Biosystems
|
Chemical
|
Civil
|
Computer
|
Electrical
|
Engineering Physics
|
Environmental
|
Geological
|
Industrial or Manufacturing
|
Materials or Metallurgical
|
Mechanical
|
Mining or Mineral
|
Software
|
Other
|
|
|---|---|---|---|---|---|---|---|---|---|---|---|---|---|---|---|
| Alberta | 217 | 278 | 71 | 168 | 104 | 90 | 225 | 95 | 69 | ||||||
| Calgary | 76 | 322 | 136 | 188 | 179 | 98 | |||||||||
| Carleton | 13 | 117 | 11 | 365 | 29 | 3 | 80 | 139 | |||||||
| Concordia | 453 | 797 | 124 | 339 | 262 | 127 | |||||||||
| Dal | 42 | 28 | 51 | 81 | 8 | 15 | 29 | 19 | 47 | 7 | 161 | ||||
| ETS | 90 | 126 | 78 | 38 | 92 | 25 | 800 | ||||||||
| Guelph | 29 | 48 | 74 | 11 | |||||||||||
| Lakehead | 3 | 43 | 14 | 14 | |||||||||||
| Laurentian | 37 | ||||||||||||||
| Laval | 72 | 95 | 107 | 37 | 62 | 109 | 11 | 1 | |||||||
| Manitoba | 63 | 105 | 168 | 57 | 86 | ||||||||||
| McGill | 13 | 93 | 111 | 303 | 141 | 185 | |||||||||
| McMaster | 51 | 75 | 62 | 83 | 139 | 58 | 2 | 59 | 108 | 37 | 62 | ||||
| Moncton | 18 | ||||||||||||||
| MUN | 43 | 70 | 52 | 25 | 52 | 223 | |||||||||
| Ottawa | 20 | 91 | 143 | 348 | 52 | 128 | 122 | ||||||||
| Polytechnique | 104 | 137 | 171 | 155 | 173 | 141 | 179 | 23 | 194 | 61 | 61 | ||||
| Queen's | 71 | 91 | 115 | 19 | 15 | 119 | 37 | ||||||||
| Regina | 43 | 42 | 34 | 9 | 102 | ||||||||||
| RMC | 24 | 19 | 36 | 9 | 7 | ||||||||||
| Ryerson | 29 | 105 | 84 | 176 | 121 | 68 | |||||||||
| Saskatchewan | 87 | 41 | 100 | 7 | 100 | 89 | |||||||||
| SFU | 92 | 90 | |||||||||||||
| Sherbrooke | 70 | 164 | 148 | 145 | 13 | ||||||||||
| SMU | 7 | ||||||||||||||
| Toronto | 223 | 230 | 260 | 493 | 74 | 468 | 153 | ||||||||
| UBC | 178 | 160 | 304 | 17 | 3 | 91 | 155 | 76 | |||||||
| UBCO | 245 | 180 | 124 | ||||||||||||
| UNB | 1 | 37 | 25 | 43 | 29 | 28 | |||||||||
| UOIT | 75 | 72 | 27 | ||||||||||||
| UQAC | 22 | 189 | |||||||||||||
| UQAR | 25 | ||||||||||||||
| UQAT | 29 | ||||||||||||||
| UQTR | 28 | 56 | 42 | ||||||||||||
| UVic | 1 | 175 | 162 | ||||||||||||
| Waterloo | 187 | 183 | 418 | 259 | 214 | ||||||||||
| Western | 191 | 181 | 209 | 127 | |||||||||||
| Windsor | 61 | 289 | 27 | 68 | 33 | 238 | |||||||||
| York | 4 | 14 | 7 | ||||||||||||
| TOTAL | 901 | 1,942 | 3,356 | 579 | 5,874 | 428 | 440 | 18 | 572 | 595 | 4,074 | 324 | 333 | 2,825 |
| Institution |
Biosystems
|
Chemical
|
Civil
|
Computer
|
Electrical
|
Engineering Physics
|
Environmental
|
Geological
|
Industrial or Manufacturing
|
Materials or Metallurgical
|
Mechanical
|
Mining or Mineral
|
Software
|
Other
|
|---|---|---|---|---|---|---|---|---|---|---|---|---|---|---|
| Alberta | ||||||||||||||
| Calgary | 0 | 6 | 8 | 8 | 6 | 5 | ||||||||
| Carleton | 5 | 30 | 1 | 71 | 6 | 1 | 7 | 19 | ||||||
| Concordia | 19 | 37 | 3 | 9 | 20 | 19 | ||||||||
| Dal | 3 | 2 | 3 | 1 | 2 | 1 | 1 | 27 | ||||||
| ETS | 49 | 38 | 16 | 7 | 25 | 22 | 231 | |||||||
| Guelph | 2 | 7 | 18 | 1 | ||||||||||
| Lakehead | ||||||||||||||
| Laurentian | ||||||||||||||
| Laval | 13 | 10 | 1 | 2 | 1 | 2 | 10 | |||||||
| Manitoba | 2 | 15 | 17 | 4 | ||||||||||
| McGill | 1 | 9 | 8 | 4 | 26 | |||||||||
| McMaster | 1 | 2 | 12 | 17 | 17 | 5 | 17 | 8 | 28 | |||||
| Moncton | 9 | |||||||||||||
| MUN | 8 | 3 | 13 | 1 | 9 | 44 | ||||||||
| NSAC | ||||||||||||||
| Ottawa | 1 | 6 | 19 | 37 | 6 | 10 | 30 | |||||||
| Polytechnique | 1 | 4 | 19 | 7 | 7 | 0 | 53 | 7 | 1 | 15 | ||||
| Queen's | 1 | 9 | 7 | 1 | 7 | 11 | ||||||||
| Regina | 9 | 9 | 8 | 3 | 9 | |||||||||
| RMC | 8 | 2 | 12 | 1 | ||||||||||
| Ryerson | 2 | 15 | 8 | 30 | 19 | 5 | ||||||||
| Saskatchewan | ||||||||||||||
| SFU | 18 | |||||||||||||
| Sherbrooke | ||||||||||||||
| SMU | ||||||||||||||
| Toronto | 0 | 12 | 33 | 54 | 2 | 61 | 5 | |||||||
| UBC | 19 | 26 | 17 | -12 | 5 | 4 | 1 | 13 | 20 | |||||
| UBCO | ||||||||||||||
| UNB | 2 | 7 | 14 | 6 | 4 | 10 | ||||||||
| UOIT | 15 | 20 | 26 | |||||||||||
| UQAC | 5 | |||||||||||||
| UQAM | ||||||||||||||
| UQAR | ||||||||||||||
| UQAT | 2 | |||||||||||||
| UQTR | 4 | 10 | 62 | |||||||||||
| UVic | ||||||||||||||
| Waterloo | 19 | 32 | 129 | 50 | 73 | |||||||||
| Western | 4 | 9 | 2 | 3 | 8 | |||||||||
| Windsor | 7 | 6 | 1 | 2 | 3 | 9 | ||||||||
| York | 3 | |||||||||||||
| TOTAL | 36 | 75 | 350 | 38 | 552 | 25 | 62 | 4 | 145 | 17 | 311 | 32 | 54 | 574 |
| Institution |
Biosystems
|
Chemical
|
Civil
|
Computer
|
Electrical
|
Engineering Physics
|
Environmental
|
Geological
|
Industrial or Manufacturing
|
Materials or Metallurgical
|
Mechanical
|
Mining or Mineral
|
Software
|
Other
|
|---|---|---|---|---|---|---|---|---|---|---|---|---|---|---|
| Alberta | 86 | 92 | 13 | 38 | 11 | 26 | 49 | 20 | 43 | |||||
| Calgary | 27 | 66 | 31 | 48 | 21 | 26 | ||||||||
| Carleton | 7 | 17 | 3 | 80 | 20 | 2 | 10 | 24 | ||||||
| Concordia | 112 | 192 | 16 | 37 | 60 | 23 | ||||||||
| Dal | 13 | 3 | 22 | 9 | 3 | 3 | 8 | 4 | 7 | 15 | ||||
| ETS | 12 | 20 | 28 | 4 | 17 | 4 | 185 | |||||||
| Guelph | 8 | 10 | 25 | 0 | ||||||||||
| Lakehead | 3 | 6 | ||||||||||||
| Laurentian | 10 | |||||||||||||
| Laval | 23 | 17 | 16 | 17 | 15 | 25 | 3 | |||||||
| Manitoba | 20 | 25 | 39 | 15 | 11 | |||||||||
| McGill | 31 | 38 | 56 | 37 | 32 | |||||||||
| McMaster | 22 | 22 | 16 | 44 | 13 | 20 | 23 | 7 | 19 | |||||
| Moncton | 2 | |||||||||||||
| MUN | 10 | 11 | 14 | 12 | 3 | 46 | ||||||||
| NSAC | ||||||||||||||
| Ottawa | 9 | 38 | 25 | 102 | 25 | 23 | 31 | |||||||
| Polytechnique | 54 | 56 | 55 | 27 | 32 | 36 | 58 | 4 | 32 | 18 | 8 | |||
| Queen's | 24 | 23 | 22 | 2 | 4 | 21 | 8 | |||||||
| Regina | 7 | 21 | 11 | 0 | 16 | |||||||||
| RMC | 6 | 4 | 2 | 2 | 1 | |||||||||
| Ryerson | 9 | 25 | 20 | 36 | 19 | 8 | ||||||||
| Saskatchewan | 20 | 17 | 12 | 3 | 15 | 19 | ||||||||
| SFU | 24 | 21 | ||||||||||||
| Sherbrooke | 18 | 32 | 22 | 12 | 3 | |||||||||
| SMU | ||||||||||||||
| Toronto | 84 | 92 | 87 | 90 | 20 | 94 | 26 | |||||||
| UBC | 59 | 42 | 73 | -6 | 7 | 2 | 37 | 20 | 21 | |||||
| UBCO | 11 | 7 | 3 | |||||||||||
| UNB | 16 | 2 | 5 | 4 | 6 | |||||||||
| UOIT | 20 | 7 | 6 | |||||||||||
| UQAC | 18 | 11 | ||||||||||||
| UQAM | 2 | |||||||||||||
| UQAR | 2 | |||||||||||||
| UQAT | 4 | |||||||||||||
| UQTR | 12 | 8 | 6 | |||||||||||
| UVic | 1 | 37 | 15 | |||||||||||
| Waterloo | 55 | 48 | 86 | 40 | 62 | |||||||||
| Western | 64 | 39 | 37 | 13 | ||||||||||
| Windsor | 4 | 56 | 10 | 12 | 7 | 16 | ||||||||
| York | 5 | |||||||||||||
| TOTAL | 322 | 637 | 789 | 97 | 1207 | 83 | 195 | 6 | 131 | 172 | 592 | 81 | 71 | 586 |
| Institution |
Biosystems
|
Chemical
|
Civil
|
Computer
|
Electrical
|
Engineering Physics
|
Environmental
|
Geological
|
Industrial or Manufacturing
|
Materials or Metallurgical
|
Mechanical
|
Mining or Mineral
|
Software
|
Other
|
|---|---|---|---|---|---|---|---|---|---|---|---|---|---|---|
| Alberta | ||||||||||||||
| Calgary | 2 | 2 | 1 | 1 | ||||||||||
| Carleton | 3 | 4 | 1 | 18 | 3 | 1 | 1 | |||||||
| Concordia | 4 | 7 | 2 | 2 | 3 | |||||||||
| Dal | 0 | 1 | ||||||||||||
| ETS | 11 | 5 | 9 | 1 | 9 | 2 | 53 | |||||||
| Guelph | 1 | 2 | 9 | |||||||||||
| Lakehead | ||||||||||||||
| Laurentian | ||||||||||||||
| Laval | 5 | 2 | 1 | |||||||||||
| Manitoba | 5 | 3 | 1 | |||||||||||
| McGill | 1 | 1 | 1 | 0 | 2 | |||||||||
| McMaster | 3 | 1 | 6 | 2 | 2 | 9 | ||||||||
| Moncton | 2 | |||||||||||||
| MUN | 2 | 1 | 1 | 1 | 2 | 5 | ||||||||
| NSAC | ||||||||||||||
| Ottawa | 0 | 3 | 5 | 8 | 2 | 0 | 8 | |||||||
| Polytechnique | 0 | 2 | 8 | 2 | 1 | 23 | 1 | 1 | 1 | |||||
| Queen's | 2 | 0 | 1 | 2 | ||||||||||
| Regina | 1 | 4 | 2 | 1 | 2 | |||||||||
| RMC | 5 | 1 | 1 | |||||||||||
| Ryerson | 2 | 2 | 1 | 4 | 4 | 2 | ||||||||
| Saskatchewan | ||||||||||||||
| SFU | 2 | |||||||||||||
| Sherbrooke | ||||||||||||||
| SMU | ||||||||||||||
| Toronto | 6 | 11 | 6 | 1 | 12 | 2 | ||||||||
| UBC | 7 | 9 | 4 | -6 | 1 | 2 | 1 | 1 | 3 | |||||
| UBCO | ||||||||||||||
| UNB | 3 | 3 | 2 | 1 | ||||||||||
| UOIT | 2 | 1 | 5 | |||||||||||
| UQAC | 3 | |||||||||||||
| UQAM | ||||||||||||||
| UQAR | ||||||||||||||
| UQAT | ||||||||||||||
| UQTR | 0 | 1 | 43 | |||||||||||
| UVic | ||||||||||||||
| Waterloo | 5 | 8 | 14 | 6 | 23 | |||||||||
| Western | 5 | 1 | 0 | |||||||||||
| Windsor | 0 | 1 | 1 | |||||||||||
| York | 2 | |||||||||||||
| TOTAL | 12 | 29 | 90 | 10 | 84 | 2 | 29 | 2 | 70 | 5 | 45 | 6 | 7 | 123 |
Post-graduate Degrees Awarded (GD)
| Discipline | 2011 | 2012 | 2013 | 2014 | 2015 |
|---|---|---|---|---|---|
| Biosystems | 135 | 131 | 186 | 153 | 159 |
| Chemical | 338 | 408 | 424 | 469 | 463 |
| Civil | 709 | 891 | 879 | 902 | 874 |
| Computer | 140 | 164 | 183 | 168 | 185 |
| Electrical | 1,143 | 1,354 | 1,441 | 1,619 | 1,539 |
| Engineering Physics | 81 | 76 | 75 | 64 | 61 |
| Environmental | 92 | 134 | 129 | 152 | 180 |
| Geological | 11 | 9 | 8 | 9 | 11 |
| Industrial or Manufacturing | 151 | 172 | 236 | 237 | 268 |
| Materials or Metallurgical | 76 | 97 | 97 | 119 | 93 |
| Mechanical | 784 | 905 | 834 | 950 | 1,062 |
| Mining or Mineral | 33 | 66 | 88 | 56 | 83 |
| Software | 50 | 65 | 88 | 124 | 149 |
| Other | 718 | 747 | 828 | 945 | 1,126 |
| TOTAL | 4,461 | 5,219 | 5,496 | 5,978 | 6,253 |
| Discipline | 2011 | 2012 | 2013 | 2014 | 2015 |
|---|---|---|---|---|---|
| Biosystems | 44 | 41 | 60 | 50 | 66 |
| Chemical | 125 | 165 | 169 | 185 | 174 |
| Civil | 147 | 170 | 187 | 171 | 213 |
| Computer | 17 | 25 | 22 | 28 | 32 |
| Electrical | 311 | 330 | 389 | 384 | 368 |
| Engineering Physics | 33 | 38 | 43 | 48 | 34 |
| Environmental | 11 | 16 | 14 | 18 | 20 |
| Geological | 2 | 1 | 0 | 1 | 7 |
| Industrial or Manufacturing | 15 | 18 | 24 | 27 | 31 |
| Materials or Metallurgical | 45 | 52 | 48 | 71 | 49 |
| Mechanical | 189 | 191 | 236 | 260 | 264 |
| Mining or Mineral | 13 | 6 | 29 | 14 | 18 |
| Software | 3 | 0 | 3 | 3 | 3 |
| Other | 84 | 109 | 106 | 124 | 146 |
| TOTAL | 1,039 | 1,162 | 1,330 | 1,389 | 1,425 |
| Discipline | 2011 | 2012 | 2013 | 2014 | 2015 |
|---|---|---|---|---|---|
| Biosystems | 59 | 63 | 74 | 66 | 63 |
| Chemical | 120 | 131 | 145 | 180 | 167 |
| Civil | 201 | 253 | 214 | 247 | 235 |
| Computer | 27 | 41 | 31 | 35 | 45 |
| Electrical | 203 | 241 | 305 | 354 | 363 |
| Engineering Physics | 19 | 22 | 16 | 14 | 14 |
| Environmental | 26 | 39 | 48 | 69 | 77 |
| Geological | 3 | 6 | 2 | 4 | 4 |
| Industrial or Manufacturing | 39 | 47 | 104 | 71 | 99 |
| Materials or Metallurgical | 17 | 32 | 30 | 39 | 26 |
| Mechanical | 111 | 126 | 105 | 132 | 146 |
| Mining or Mineral | 15 | 18 | 16 | 17 | 17 |
| Software | 14 | 16 | 15 | 23 | 40 |
| Other | 140 | 131 | 170 | 195 | 238 |
| TOTAL | 994 | 1,166 | 1,275 | 1,453 | 1,534 |
| Discipline | 2011 | 2012 | 2013 | 2014 | 2015 |
|---|---|---|---|---|---|
| Biosystems | 17 | 17 | 25 | 16 | 21 |
| Chemical | 36 | 50 | 39 | 65 | 61 |
| Civil | 43 | 39 | 32 | 31 | 49 |
| Computer | 6 | 10 | 6 | 7 | 3 |
| Electrical | 40 | 54 | 45 | 54 | 60 |
| Engineering Physics | 5 | 3 | 4 | 8 | 11 |
| Environmental | 6 | 3 | 3 | 4 | 4 |
| Geological | 1 | 1 | 0 | 0 | 1 |
| Industrial or Manufacturing | 2 | 1 | 3 | 7 | 9 |
| Materials or Metallurgical | 9 | 13 | 10 | 21 | 15 |
| Mechanical | 20 | 18 | 34 | 49 | 49 |
| Mining or Mineral | 6 | 2 | 5 | 1 | 3 |
| Software | 2 | 0 | 2 | 2 | 0 |
| Other | 15 | 28 | 12 | 23 | 28 |
| TOTAL | 208 | 239 | 220 | 288 | 314 |
| Discipline | 2011 | 2012 | 2013 | 2014 | 2015 |
|---|---|---|---|---|---|
| Biosystems | 33 | 32 | 61 | 61 | 50 |
| Chemical | 106 | 183 | 156 | 248 | 264 |
| Civil | 200 | 320 | 269 | 328 | 354 |
| Computer | 40 | 76 | 74 | 99 | 95 |
| Electrical | 482 | 724 | 756 | 1,031 | 966 |
| Engineering Physics | 22 | 25 | 24 | 20 | 22 |
| Environmental | 34 | 48 | 69 | 78 | 107 |
| Geological | 2 | 0 | 2 | 2 | 2 |
| Industrial or Manufacturing | 70 | 75 | 83 | 114 | 120 |
| Materials or Metallurgical | 35 | 47 | 48 | 52 | 39 |
| Mechanical | 264 | 325 | 314 | 436 | 530 |
| Mining or Mineral | 11 | 36 | 38 | 37 | 47 |
| Software | 19 | 26 | 51 | 75 | 118 |
| Other | 305 | 340 | 426 | 551 | 723 |
| TOTAL | 1,623 | 2,257 | 2,371 | 3,141 | 3,437 |
| Discipline | 2011 | 2012 | 2013 | 2014 | 2015 |
|---|---|---|---|---|---|
| Biosystems | 3 | 3 | 13 | 11 | 15 |
| Chemical | 42 | 45 | 56 | 56 | 65 |
| Civil | 23 | 33 | 35 | 48 | 84 |
| Computer | 5 | 7 | 6 | 10 | 12 |
| Electrical | 55 | 89 | 110 | 122 | 137 |
| Engineering Physics | 6 | 9 | 11 | 18 | 13 |
| Environmental | 6 | 3 | 4 | 9 | 11 |
| Geological | 0 | 0 | 0 | 0 | 4 |
| Industrial or Manufacturing | 2 | 6 | 5 | 10 | 12 |
| Materials or Metallurgical | 11 | 14 | 20 | 28 | 20 |
| Mechanical | 47 | 36 | 60 | 96 | 97 |
| Mining or Mineral | 3 | 1 | 9 | 5 | 5 |
| Software | 0 | 0 | 2 | 2 | 1 |
| Other | 21 | 33 | 31 | 44 | 72 |
| TOTAL | 224 | 279 | 362 | 463 | 548 |
| Province | 2011 | 2012 | 2013 | 2014 | 2015 |
|---|---|---|---|---|---|
| AB | 505 | 644 | 460 | 494 | 433 |
| BC | 344 | 404 | 340 | 317 | 345 |
| MB | 45 | 62 | 62 | 74 | 89 |
| NB | 59 | 65 | 50 | 67 | 24 |
| NL | 68 | 79 | 103 | 120 | 131 |
| NS | 114 | 128 | 173 | 217 | 341 |
| ON | 2,173 | 2,323 | 2,652 | 2,905 | 3,057 |
| QC | 1,053 | 1,394 | 1,537 | 1,644 | 1,689 |
| SK | 100 | 120 | 119 | 140 | 144 |
| TOTAL | 4,461 | 5,219 | 5,496 | 5,978 | 6,253 |
| Province | 2011 | 2012 | 2013 | 2014 | 2015 |
|---|---|---|---|---|---|
| AB | 130 | 154 | 203 | 221 | 153 |
| BC | 106 | 98 | 126 | 111 | 116 |
| MB | 27 | 39 | 28 | 29 | 27 |
| NB | 6 | 13 | 18 | 16 | 11 |
| NL | 10 | 7 | 12 | 14 | 19 |
| NS | 14 | 11 | 16 | 18 | 19 |
| ON | 463 | 500 | 552 | 520 | 619 |
| QC | 259 | 313 | 354 | 425 | 425 |
| SK | 24 | 27 | 21 | 35 | 36 |
| TOTAL | 1,039 | 1,162 | 1,330 | 1,389 | 1,425 |
| Province | 2011 | 2012 | 2013 | 2014 | 2015 |
|---|---|---|---|---|---|
| AB | 112 | 159 | 106 | 145 | 116 |
| BC | 111 | 101 | 87 | 75 | 70 |
| MB | 11 | 15 | 14 | 14 | 21 |
| NB | 10 | 9 | 12 | 17 | 5 |
| NL | 11 | 19 | 28 | 28 | 34 |
| NS | 16 | 24 | 27 | 26 | 40 |
| ON | 474 | 496 | 578 | 732 | 755 |
| QC | 221 | 308 | 389 | 370 | 451 |
| SK | 28 | 35 | 34 | 46 | 42 |
| TOTAL | 994 | 1,166 | 1,275 | 1,453 | 1,534 |
| Province | 2011 | 2012 | 2013 | 2014 | 2015 |
|---|---|---|---|---|---|
| AB | 25 | 35 | 31 | 44 | 35 |
| BC | 18 | 16 | 27 | 25 | 20 |
| MB | 3 | 4 | 4 | 6 | 3 |
| NB | 1 | 2 | 3 | 4 | 3 |
| NL | 2 | 0 | 2 | 3 | 0 |
| NS | 2 | 1 | 5 | 4 | 4 |
| ON | 100 | 118 | 90 | 103 | 143 |
| QC | 54 | 57 | 51 | 90 | 100 |
| SK | 3 | 6 | 7 | 9 | 6 |
| TOTAL | 208 | 239 | 220 | 288 | 314 |
| Province | 2011 | 2012 | 2013 | 2014 | 2015 |
|---|---|---|---|---|---|
| AB | 246 | 373 | 215 | 279 | 242 |
| BC | 161 | 174 | 164 | 142 | 177 |
| MB | 22 | 23 | 28 | 48 | 46 |
| NB | 28 | 39 | 31 | 35 | 20 |
| NL | 56 | 59 | 87 | 103 | 113 |
| NS | 80 | 84 | 137 | 173 | 284 |
| ON | 578 | 800 | 946 | 1,398 | 1,532 |
| QC | 386 | 634 | 676 | 862 | 908 |
| SK | 66 | 71 | 87 | 101 | 115 |
| TOTAL | 1,623 | 2,257 | 2,371 | 3,141 | 3,437 |
| Province | 2011 | 2012 | 2013 | 2014 | 2015 |
|---|---|---|---|---|---|
| AB | 26 | 44 | 66 | 84 | 77 |
| BC | 32 | 39 | 46 | 57 | 64 |
| MB | 3 | 8 | 5 | 9 | 12 |
| NB | 2 | 8 | 12 | 7 | 7 |
| NL | 4 | 4 | 3 | 8 | 5 |
| NS | 3 | 2 | 3 | 5 | 5 |
| ON | 73 | 98 | 106 | 134 | 190 |
| QC | 73 | 67 | 110 | 133 | 167 |
| SK | 8 | 9 | 11 | 26 | 21 |
| TOTAL | 224 | 279 | 362 | 463 | 548 |
| Discipline | AB | BC | MB | NB | NL | NS | ON | QC | SK | TOTAL |
|---|---|---|---|---|---|---|---|---|---|---|
| Biosystems | 13 | 31 | 16 | 11 | 58 | 23 | 7 | 159 | ||
| Chemical | 146 | 2 | 5 | 257 | 46 | 7 | 463 | |||
| Civil | 74 | 73 | 27 | 5 | 9 | 396 | 277 | 13 | 874 | |
| Computer | 21 | 3 | 17 | 108 | 17 | 19 | 185 | |||
| Electrical | 61 | 72 | 22 | 4 | 7 | 21 | 880 | 455 | 17 | 1,539 |
| Engineering Physics | 6 | 19 | 1 | 20 | 15 | 61 | ||||
| Environmental | 20 | 23 | 6 | 77 | 33 | 21 | 180 | |||
| Geological | 9 | 2 | 11 | |||||||
| Industrial or Manufacturing | 17 | 4 | 39 | 197 | 11 | 268 | ||||
| Materials or Metallurgical | 1 | 6 | 5 | 55 | 26 | 93 | ||||
| Mechanical | 68 | 87 | 7 | 9 | 4 | 19 | 630 | 222 | 16 | 1,062 |
| Mining or Mineral | 13 | 25 | 30 | 15 | 83 | |||||
| Software | 16 | 126 | 7 | 149 | ||||||
| Other | 30 | 9 | 75 | 260 | 489 | 237 | 26 | 1,126 | ||
| TOTAL | 433 | 345 | 89 | 24 | 131 | 341 | 3,057 | 1,689 | 144 | 6,253 |
| Discipline | AB | BC | MB | NB | NL | NS | ON | QC | SK | TOTAL |
|---|---|---|---|---|---|---|---|---|---|---|
| Biosystems | 2 | 8 | 3 | 3 | 28 | 14 | 8 | 66 | ||
| Chemical | 39 | 2 | 87 | 43 | 3 | 174 | ||||
| Civil | 34 | 9 | 4 | 1 | 5 | 4 | 104 | 52 | 213 | |
| Computer | 1 | 5 | 1 | 16 | 9 | 32 | ||||
| Electrical | 21 | 36 | 8 | 4 | 5 | 5 | 177 | 106 | 6 | 368 |
| Engineering Physics | 4 | 10 | 1 | 6 | 13 | 34 | ||||
| Environmental | 9 | 7 | 4 | 20 | ||||||
| Geological | 7 | 7 | ||||||||
| Industrial or Manufacturing | 12 | 1 | 3 | 11 | 4 | 31 | ||||
| Materials or Metallurgical | 7 | 19 | 23 | 49 | ||||||
| Mechanical | 23 | 39 | 2 | 2 | 3 | 115 | 71 | 9 | 264 | |
| Mining or Mineral | 8 | 2 | 2 | 5 | 1 | 18 | ||||
| Software | 3 | 3 | ||||||||
| Other | 21 | 2 | 6 | 40 | 75 | 2 | 146 | |||
| TOTAL | 153 | 116 | 27 | 11 | 19 | 19 | 619 | 425 | 36 | 1,425 |
| Institution | 2011 | 2012 | 2013 | 2014 | 2015 |
|---|---|---|---|---|---|
| Acadia | 0 | ||||
| Alberta | 334 | 329 | 281 | 279 | 239 |
| BCIT | 0 | 0 | 0 | 0 | 0 |
| Calgary | 171 | 315 | 179 | 215 | 194 |
| Carleton | 147 | 177 | 193 | 230 | 251 |
| Concordia | 400 | 534 | 572 | 626 | 667 |
| Conestoga | 0 | 0 | 0 | 0 | 0 |
| Dal | 114 | 128 | 173 | 205 | 341 |
| ETS | 178 | 239 | 259 | 293 | 385 |
| Guelph | 40 | 46 | 44 | 44 | 46 |
| Lakehead | 20 | 14 | 16 | 0 | 8 |
| Laurentian | 0 | 0 | 61 | 0 | 11 |
| Laval | 76 | 75 | 70 | 70 | 60 |
| Manitoba | 45 | 62 | 62 | 74 | 89 |
| McGill | 35 | 122 | 157 | 124 | 153 |
| McMaster | 250 | 225 | 255 | 230 | 250 |
| Moncton | 8 | 1 | 2 | 4 | 0 |
| MUN | 68 | 79 | 103 | 120 | 131 |
| NSAC | 11 | 0 | |||
| Ottawa | 128 | 165 | 241 | 465 | 414 |
| Polytechnique | 254 | 281 | 281 | 334 | 222 |
| Queen's | 92 | 103 | 113 | 106 | 118 |
| Regina | 36 | 49 | 60 | 76 | 83 |
| RMC | 0 | 26 | 22 | 19 | 16 |
| Ryerson | 247 | 231 | 295 | 189 | 176 |
| Saskatchewan | 64 | 71 | 59 | 64 | 61 |
| SFU | 40 | 37 | 38 | 28 | 31 |
| Sherbrooke | 86 | 61 | 65 | 90 | 91 |
| SMU | 1 | ||||
| Toronto | 401 | 482 | 496 | 540 | 631 |
| UBC | 237 | 300 | 251 | 237 | 237 |
| UBCO | 38 | 22 | 20 | 24 | 37 |
| UNB | 51 | 64 | 48 | 63 | 24 |
| UNBC | 0 | 0 | 0 | 0 | 0 |
| UOIT | 67 | 47 | 30 | 36 | 39 |
| UQAC | 11 | 22 | 8 | 12 | 8 |
| UQAM | 0 | 0 | 0 | 5 | |
| UQAR | 5 | 7 | 8 | 2 | 5 |
| UQAT | 5 | 13 | 19 | 10 | 5 |
| UQO | 0 | 0 | 0 | 0 | 0 |
| UQTR | 3 | 40 | 98 | 78 | 93 |
| UVic | 29 | 45 | 31 | 28 | 40 |
| Waterloo | 452 | 415 | 502 | 486 | 480 |
| Western | 132 | 175 | 131 | 187 | 217 |
| Windsor | 195 | 217 | 253 | 373 | 396 |
| York | 2 | 0 | 0 | 4 | |
| TOTAL | 4,461 | 5,219 | 5,496 | 5,978 | 6,253 |
| Institution | 2011 | 2012 | 2013 | 2014 | 2015 |
|---|---|---|---|---|---|
| Acadia | 0 | ||||
| Alberta | 71 | 78 | 111 | 126 | 83 |
| BCIT | 0 | 0 | 0 | 0 | 0 |
| Calgary | 59 | 76 | 92 | 95 | 70 |
| Carleton | 28 | 23 | 36 | 30 | 36 |
| Concordia | 49 | 70 | 60 | 53 | 56 |
| Conestoga | 0 | 0 | 0 | 0 | 0 |
| Dal | 14 | 11 | 16 | 13 | 19 |
| ETS | 29 | 41 | 35 | 44 | 58 |
| Guelph | 2 | 4 | 9 | 7 | 12 |
| Lakehead | 0 | 0 | 0 | 0 | 0 |
| Laurentian | 0 | 0 | 31 | 0 | 3 |
| Laval | 42 | 24 | 33 | 33 | 40 |
| Manitoba | 27 | 39 | 28 | 29 | 27 |
| McGill | 26 | 59 | 100 | 120 | 106 |
| McMaster | 52 | 66 | 40 | 36 | 65 |
| Moncton | 0 | 0 | 0 | 0 | 0 |
| MUN | 10 | 7 | 12 | 14 | 19 |
| NSAC | 5 | 0 | |||
| Ottawa | 24 | 28 | 21 | 39 | 25 |
| Polytechnique | 80 | 80 | 88 | 117 | 95 |
| Queen's | 30 | 35 | 46 | 36 | 52 |
| Regina | 7 | 13 | 7 | 17 | 10 |
| RMC | 0 | 8 | 4 | 6 | 3 |
| Ryerson | 21 | 25 | 42 | 39 | 44 |
| Saskatchewan | 17 | 14 | 14 | 18 | 26 |
| SFU | 8 | 13 | 12 | 12 | 24 |
| Sherbrooke | 25 | 25 | 27 | 42 | 48 |
| SMU | 0 | ||||
| Toronto | 106 | 115 | 106 | 110 | 152 |
| UBC | 82 | 67 | 93 | 67 | 50 |
| UBCO | 2 | 1 | 7 | 7 | 15 |
| UNB | 6 | 13 | 18 | 16 | 11 |
| UNBC | 0 | 0 | 0 | 0 | 0 |
| UOIT | 2 | 6 | 10 | 16 | 14 |
| UQAC | 8 | 9 | 5 | 9 | 14 |
| UQAM | 0 | 0 | 0 | 0 | |
| UQAR | 0 | 0 | 0 | 0 | 0 |
| UQAT | 0 | 0 | 0 | 0 | 0 |
| UQO | 0 | 0 | 0 | 0 | 0 |
| UQTR | 0 | 5 | 6 | 7 | 8 |
| UVic | 14 | 17 | 14 | 25 | 27 |
| Waterloo | 116 | 115 | 134 | 125 | 150 |
| Western | 55 | 58 | 53 | 50 | 40 |
| Windsor | 27 | 17 | 20 | 26 | 23 |
| York | 0 | 0 | 0 | 0 | |
| TOTAL | 1,039 | 1,162 | 1,330 | 1,389 | 1,425 |
| Institution | 2011 | 2012 | 2013 | 2014 | 2015 |
|---|---|---|---|---|---|
| Acadia | 0 | ||||
| Alberta | 66 | 87 | 63 | 81 | 66 |
| BCIT | 0 | 0 | 0 | 0 | 0 |
| Calgary | 46 | 72 | 43 | 64 | 50 |
| Carleton | 36 | 34 | 31 | 51 | 56 |
| Concordia | 88 | 104 | 129 | 124 | 179 |
| Conestoga | 0 | 0 | 0 | 0 | 0 |
| Dal | 16 | 24 | 27 | 19 | 40 |
| ETS | 29 | 49 | 39 | 54 | 85 |
| Guelph | 10 | 12 | 11 | 11 | 16 |
| Lakehead | 3 | 3 | 2 | 0 | 1 |
| Laurentian | 0 | 0 | 8 | 0 | 1 |
| Laval | 12 | 17 | 20 | 20 | 17 |
| Manitoba | 11 | 15 | 14 | 14 | 21 |
| McGill | 5 | 23 | 53 | 31 | 32 |
| McMaster | 48 | 56 | 67 | 90 | 72 |
| Moncton | 0 | 0 | 0 | 0 | 0 |
| MUN | 11 | 19 | 28 | 28 | 34 |
| NSAC | 7 | 0 | |||
| Ottawa | 23 | 28 | 57 | 125 | 123 |
| Polytechnique | 68 | 84 | 74 | 87 | 68 |
| Queen's | 20 | 29 | 32 | 30 | 26 |
| Regina | 6 | 7 | 13 | 26 | 26 |
| RMC | 0 | 6 | 4 | 2 | 1 |
| Ryerson | 42 | 39 | 39 | 40 | 41 |
| Saskatchewan | 22 | 28 | 21 | 20 | 16 |
| SFU | 13 | 9 | 8 | 5 | 6 |
| Sherbrooke | 14 | 12 | 12 | 10 | 12 |
| SMU | 0 | ||||
| Toronto | 104 | 107 | 125 | 146 | 164 |
| UBC | 83 | 76 | 62 | 60 | 49 |
| UBCO | 6 | 3 | 11 | 6 | 6 |
| UNB | 10 | 9 | 12 | 17 | 5 |
| UNBC | 0 | 0 | 0 | 0 | 0 |
| UOIT | 11 | 2 | 5 | 5 | 9 |
| UQAC | 4 | 3 | 0 | 4 | 1 |
| UQAM | 0 | 0 | 0 | 0 | |
| UQAR | 1 | 0 | 0 | 0 | 0 |
| UQAT | 0 | 0 | 3 | 0 | 0 |
| UQO | 0 | 0 | 0 | 0 | 0 |
| UQTR | 0 | 16 | 59 | 40 | 57 |
| UVic | 9 | 13 | 6 | 4 | 9 |
| Waterloo | 108 | 108 | 123 | 112 | 129 |
| Western | 34 | 39 | 30 | 53 | 64 |
| Windsor | 35 | 33 | 44 | 67 | 50 |
| York | 0 | 0 | 0 | 2 | |
| TOTAL | 994 | 1,166 | 1,275 | 1,453 | 1,534 |
| Institution | 2011 | 2012 | 2013 | 2014 | 2015 |
|---|---|---|---|---|---|
| Acadia | 0 | ||||
| Alberta | 16 | 18 | 16 | 22 | 22 |
| BCIT | 0 | 0 | 0 | 0 | 0 |
| Calgary | 9 | 17 | 15 | 22 | 13 |
| Carleton | 7 | 7 | 3 | 1 | 6 |
| Concordia | 7 | 8 | 9 | 12 | 8 |
| Conestoga | 0 | 0 | 0 | 0 | 0 |
| Dal | 2 | 1 | 5 | 4 | 4 |
| ETS | 5 | 8 | 3 | 7 | 12 |
| Guelph | 1 | 0 | 1 | 1 | 1 |
| Lakehead | 0 | 0 | 0 | 0 | 0 |
| Laurentian | 0 | 0 | 3 | 0 | 1 |
| Laval | 9 | 5 | 0 | 0 | 9 |
| Manitoba | 3 | 4 | 4 | 6 | 3 |
| McGill | 3 | 12 | 14 | 30 | 26 |
| McMaster | 16 | 20 | 9 | 8 | 13 |
| Moncton | 0 | 0 | 0 | 0 | 0 |
| MUN | 2 | 0 | 2 | 3 | 0 |
| NSAC | 0 | 0 | |||
| Ottawa | 5 | 10 | 4 | 5 | 3 |
| Polytechnique | 20 | 14 | 20 | 32 | 25 |
| Queen's | 7 | 8 | 6 | 6 | 11 |
| Regina | 3 | 4 | 3 | 5 | 3 |
| RMC | 0 | 1 | 0 | 2 | 2 |
| Ryerson | 3 | 4 | 8 | 9 | 11 |
| Saskatchewan | 0 | 2 | 4 | 4 | 3 |
| SFU | 1 | 1 | 0 | 4 | 5 |
| Sherbrooke | 5 | 6 | 3 | 7 | 14 |
| SMU | 0 | ||||
| Toronto | 19 | 31 | 20 | 23 | 45 |
| UBC | 16 | 12 | 24 | 17 | 9 |
| UBCO | 0 | 0 | 0 | 0 | 2 |
| UNB | 1 | 2 | 3 | 4 | 3 |
| UNBC | 0 | 0 | 0 | 0 | 0 |
| UOIT | 0 | 1 | 0 | 5 | 2 |
| UQAC | 5 | 4 | 1 | 1 | 5 |
| UQAM | 0 | 0 | 0 | 0 | |
| UQAR | 0 | 0 | 0 | 0 | 0 |
| UQAT | 0 | 0 | 0 | 0 | 0 |
| UQO | 0 | 0 | 0 | 0 | 0 |
| UQTR | 0 | 0 | 1 | 1 | 1 |
| UVic | 1 | 3 | 2 | 4 | 4 |
| Waterloo | 17 | 26 | 22 | 26 | 37 |
| Western | 17 | 8 | 8 | 10 | 8 |
| Windsor | 8 | 2 | 6 | 7 | 3 |
| York | 0 | 0 | 0 | 0 | |
| TOTAL | 208 | 239 | 220 | 288 | 314 |
| Institution |
Biosystems
|
Chemical
|
Civil
|
Computer
|
Electrical
|
Engineering Physics
|
Environmental
|
Geological
|
Industrial or Manufacturing
|
Materials or Metallurgical
|
Mechanical
|
Mining or Mineral
|
Software
|
Other
|
|
|---|---|---|---|---|---|---|---|---|---|---|---|---|---|---|---|
| Alberta | 64 | 57 | 21 | 25 | 6 | 1 | 36 | 13 | 16 | ||||||
| BCIT | |||||||||||||||
| Calgary | 13 | 82 | 17 | 36 | 32 | 14 | |||||||||
| Carleton | 8 | 43 | 6 | 96 | 19 | 1 | 24 | 54 | |||||||
| Concordia | 127 | 293 | 46 | 72 | 117 | 12 | |||||||||
| Conestoga | |||||||||||||||
| Dal | 0 | 0 | 0 | 0 | 0 | 1 | 6 | 4 | 5 | 19 | 260 | ||||
| ETS | 57 | 53 | 26 | 25 | 36 | 9 | 179 | ||||||||
| Guelph | 9 | 18 | 17 | 2 | |||||||||||
| Lakehead | 5 | 3 | |||||||||||||
| Laurentian | 11 | ||||||||||||||
| Laval | 6 | 5 | 21 | 5 | 2 | 13 | 6 | 2 | |||||||
| Manitoba | 16 | 27 | 22 | 17 | 7 | ||||||||||
| McGill | 18 | 15 | 53 | 23 | 44 | ||||||||||
| McMaster | 5 | 10 | 14 | 17 | 51 | 11 | 3 | 14 | 36 | 16 | 73 | ||||
| Moncton | |||||||||||||||
| MUN | 5 | 17 | 7 | 23 | 4 | 75 | |||||||||
| NSAC | |||||||||||||||
| Ottawa | 7 | 53 | 58 | 87 | 24 | 56 | 129 | ||||||||
| Polytechnique | 17 | 15 | 31 | 17 | 24 | 15 | 42 | 1 | 31 | 9 | 20 | ||||
| Queen's | 13 | 30 | 20 | 9 | 2 | 25 | 19 | ||||||||
| Regina | 19 | 20 | 11 | 7 | 26 | ||||||||||
| RMC | 6 | 1 | 4 | 3 | 2 | ||||||||||
| Ryerson | 1 | 26 | 63 | 42 | 29 | 15 | |||||||||
| Saskatchewan | 7 | 7 | 13 | 17 | 1 | 16 | |||||||||
| SFU | 18 | 13 | |||||||||||||
| Sherbrooke | 7 | 26 | 24 | 26 | 8 | ||||||||||
| Toronto | 29 | 68 | 103 | 142 | 27 | 202 | 60 | ||||||||
| UBC | 31 | 55 | 47 | 1 | 20 | 9 | 6 | 43 | 25 | ||||||
| UBCO | 18 | 7 | 12 | ||||||||||||
| UNB | 2 | 4 | 9 | 9 | |||||||||||
| UNBC | |||||||||||||||
| UOIT | 8 | 21 | 10 | ||||||||||||
| UQAC | 2 | 6 | |||||||||||||
| UQAR | 5 | ||||||||||||||
| UQAT | 5 | ||||||||||||||
| UQO | |||||||||||||||
| UQTR | 1 | 8 | 84 | ||||||||||||
| UVic | 3 | 18 | 19 | ||||||||||||
| Waterloo | 53 | 42 | 162 | 77 | 146 | ||||||||||
| Western | 53 | 53 | 76 | 3 | 32 | ||||||||||
| Windsor | 26 | 187 | 14 | 33 | 13 | 123 | |||||||||
| York | 4 | ||||||||||||||
| TOTAL | 159 | 463 | 874 | 185 | 1,539 | 61 | 180 | 11 | 268 | 93 | 1,062 | 83 | 149 | 1,126 |
| Institution |
Biosystems
|
Chemical
|
Civil
|
Computer
|
Electrical
|
Engineering Physics
|
Environmental
|
Geological
|
Industrial or Manufacturing
|
Materials or Metallurgical
|
Mechanical
|
Mining or Mineral
|
Software
|
Other
|
|---|---|---|---|---|---|---|---|---|---|---|---|---|---|---|
| Alberta | 18 | 18 | 1 | 10 | 4 | 17 | 8 | 7 | ||||||
| BCIT | ||||||||||||||
| Calgary | 2 | 21 | 16 | 11 | 6 | 14 | ||||||||
| Carleton | 6 | 18 | 4 | 1 | 7 | |||||||||
| Concordia | 14 | 25 | 2 | 15 | ||||||||||
| Conestoga | ||||||||||||||
| Dal | 0 | 0 | 0 | 0 | 0 | 1 | 1 | 3 | 2 | |||||
| ETS | 58 | |||||||||||||
| Guelph | 7 | 4 | 1 | |||||||||||
| Lakehead | ||||||||||||||
| Laurentian | 3 | |||||||||||||
| Laval | 10 | 2 | 13 | 3 | 12 | |||||||||
| Manitoba | 3 | 4 | 8 | 12 | ||||||||||
| McGill | 12 | 12 | 41 | 19 | 22 | |||||||||
| McMaster | 6 | 10 | 10 | 9 | 6 | 5 | 8 | 8 | 3 | |||||
| Moncton | ||||||||||||||
| MUN | 5 | 1 | 5 | 2 | 6 | |||||||||
| NSAC | ||||||||||||||
| Ottawa | 4 | 7 | 8 | 6 | ||||||||||
| Polytechnique | 14 | 14 | 8 | 9 | 7 | 13 | 7 | 4 | 11 | 1 | 7 | |||
| Queen's | 13 | 7 | 14 | 1 | 7 | 8 | 2 | |||||||
| Regina | 4 | 4 | 2 | |||||||||||
| RMC | 2 | 1 | ||||||||||||
| Ryerson | 3 | 8 | 14 | 17 | 2 | |||||||||
| Saskatchewan | 8 | 3 | 6 | 9 | ||||||||||
| SFU | 10 | 14 | ||||||||||||
| Sherbrooke | 5 | 16 | 16 | 11 | ||||||||||
| Toronto | 22 | 13 | 24 | 41 | 8 | 33 | 11 | |||||||
| UBC | 8 | 2 | 19 | 7 | 12 | 2 | ||||||||
| UBCO | 7 | 5 | 3 | |||||||||||
| UNB | 2 | 1 | 4 | 2 | 2 | |||||||||
| UNBC | ||||||||||||||
| UOIT | 3 | 9 | 2 | |||||||||||
| UQAC | 4 | 10 | ||||||||||||
| UQAR | ||||||||||||||
| UQAT | ||||||||||||||
| UQO | ||||||||||||||
| UQTR | 2 | 4 | 2 | |||||||||||
| UVic | 5 | 12 | 10 | |||||||||||
| Waterloo | 28 | 26 | 56 | 22 | 18 | |||||||||
| Western | 14 | 13 | 10 | 3 | ||||||||||
| Windsor | 3 | 7 | 1 | 3 | 3 | 6 | ||||||||
| York | ||||||||||||||
| TOTAL | 66 | 174 | 213 | 32 | 368 | 34 | 20 | 7 | 31 | 49 | 264 | 18 | 3 | 146 |
Faculty Members by Institution (F)
| Institution |
Male Professors
|
Female Professors
|
Male Associate Professors
|
Female Associate Professors
|
Male Assistant Professors
|
Female Assistant Professors
|
Male Instructors/Lecturers
|
Female Instructors/Lecturers
|
Total Full Time Equivalent
|
|
|---|---|---|---|---|---|---|---|---|---|---|
| Acadia | 2 | 1 | 1 | 0 | ||||||
| Alberta | 88 | 4 | 47 | 7 | 40 | 9 | ||||
| BCIT | 41 | 6 | ||||||||
| Calgary | 76 | 10 | 34 | 10 | 19 | 8 | 0 | 0 | 157 | |
| Cape Breton | 2 | 0 | 0 | 0 | 0 | 0 | 3 | 0 | 4 | |
| Carleton | 56 | 4 | 53 | 4 | 19 | 3 | 11 | 8 | 158 | |
| Concordia | 74 | 11 | 45 | 9 | 21 | 6 | 15 | 4 | 185 | |
| Conestoga | 16 | 1 | 0 | 0 | 0 | 0 | 0 | 0 | 17 | |
| Dal | 42 | 4 | 22 | 6 | 8 | 2 | 13 | 1 | 97 | |
| ETS | 73 | 11 | 90 | 15 | 11 | 6 | 143 | 29 | 378 | |
| Guelph | 11 | 3 | 14 | 2 | 11 | 6 | 4 | 1 | 52 | |
| Lakehead | 14 | 1 | 12 | 1 | 10 | 2 | ||||
| Laurentian | 10 | 1 | 9 | 3 | 1 | |||||
| Manitoba | 36 | 4 | 19 | 5 | 12 | 3 | 5 | 1 | 83 | |
| McGill | 43 | 1 | 64 | 8 | 21 | 5 | 1 | |||
| McMaster | 83 | 5 | 34 | 4 | 14 | 9 | 2 | 0 | 150 | |
| Moncton | 11 | 0 | 5 | 32 | 3 | 1 | ||||
| MUN | 25 | 2 | 23 | 4 | 15 | 4 | 5 | 2 | 79 | |
| NSAC | 3 | 0 | 5 | 2 | 1 | 4 | 1 | |||
| Ottawa | 50 | 10 | 24 | 10 | 14 | 5 | 10 | 1 | 124 | |
| Polytechnique | 128 | 17 | 42 | 7 | 36 | 5 | 15 | 5 | 255 | |
| Queen's | 69 | 13 | 24 | 1 | 10 | 4 | 7 | 1 | 129 | |
| Regina | 17 | 4 | 10 | 1 | 4 | 1 | 11 | 1 | 49 | |
| RMC | 25 | 23 | 3 | 4 | 2 | 19 | ||||
| Ryerson | 70 | 6 | 36 | 7 | 5 | 1 | 31 | 4 | 160 | |
| Saskatchewan | 38 | 1 | 25 | 3 | 15 | 3 | 1 | 2 | 88 | |
| SFU | 19 | 3 | 7 | 2 | 3 | 1 | 8 | 2 | 45 | |
| Sherbrooke | 60 | 4 | 24 | 2 | 9 | 0 | 101 | 18 | 218 | |
| SMU | 1 | 0 | 1 | 0 | 3 | 0 | 0 | 0 | 5 | |
| StFX | 1 | 0 | 1 | 0 | 1 | |||||
| Toronto | 117 | 16 | 44 | 17 | 24 | 8 | 16 | 4 | 246 | |
| UBC | 87 | 11 | 33 | 5 | 12 | 5 | 22 | 11 | 186 | |
| UBCO | 3 | 2 | 16 | 1 | 13 | 1 | 5 | 3 | 44 | |
| UNB | 36 | 6 | 9 | 2 | 6 | 1 | 6 | 0 | 65 | |
| UNBC | 3 | 1 | ||||||||
| UOIT | 15 | 0 | 18 | 4 | 7 | 2 | 8 | 0 | 54 | |
| UPEI | 2 | 2 | 1 | 2 | 1 | 1 | ||||
| UQAC | 12 | 3 | 13 | 1 | 1 | 1 | 11 | 1 | 43 | |
| UQAM | ||||||||||
| UQAR | 10 | 0 | 0 | 0 | 0 | 0 | 6 | 1 | 17 | |
| UQAT | 5 | 5 | 1 | 1 | 1 | |||||
| UQTR | 20 | 1 | 9 | 3 | 0 | 0 | ||||
| UVic | 31 | 5 | 16 | 3 | 6 | 2 | ||||
| Waterloo | 115 | 16 | 66 | 14 | 36 | 12 | 24 | 7 | 288 | |
| Western | 43 | 4 | 27 | 6 | 7 | 1 | 9 | 0 | 96 | |
| Windsor | 37 | 2 | 19 | 6 | 2 | 1 | 4 | 1 | 71 | |
| York | 16 | 1 | 19 | 3 | 14 | 2 | 2 | |||
| TOTAL | 1730 | 192 | 989 | 206 | 445 | 121 | 524 | 111 | 3540 |
| Undergrad | Bachelor's Awarded | Graduate | Master's/PhD Awarded | |
|---|---|---|---|---|
| Indigenous Students | 337 | 57 | 69 | 21 |
| Total Students | 34,835 | 6,970 | 8,917 | 3,467 |
| 0.97% | 0.82% | 0.77% | 0.61% |
Co-op Internship and Professional Experience Programs
| Institution | Type of Program | Mandatory/Optional |
|---|---|---|
| Alberta | Co-op | Optional |
| BCIT | Internship | Mandatory |
| Calgary | Internship | Optional |
| Carleton | Co-op | Optional |
| Concordia | Co-op & Internship | Optional |
| Conestoga | Co-op | Mandatory |
| ETS | Co-op | Mandatory |
| Guelph | Co-op | Optional |
| Laurentian | Co-op | Optional |
| Laval | Internship | Optional |
| Manitoba | Co-op | Optional |
| McGill | Co-op & Internship | Varies |
| McMaster | Co-op | Optional |
| Moncton | Co-op | Optional |
| MUN | Co-op | Mandatory |
| Ottawa | Co-op | Varies |
| Queen's | Internship | Optional |
| Regina | Co-op & Internship | Optional |
| RMC | Co-op | Optional |
| Ryerson | Co-op & Internship | Optional |
| Saskatchewan | Internship | Optional |
| SFU | Co-op | Varies |
| Sherbrooke | Co-op | Mandatory |
| Toronto | Internship | Optional |
| UBC | Co-op | Optional |
| UBCO | Co-op | Optional |
| UNB | Co-op | Optional |
| UQAR | Co-op | Optional |
| UQAT | Co-op | Optional |
| UQO | Internship | Mandatory |
| UQTR | Co-op | Optional |
| UVic | Co-op | Mandatory |
| Waterloo | Co-op | Mandatory |
| Western | Co-op & Internship | Optional |
| Windsor | Co-op & Internship | Optional |
| York | Co-op | Optional |
Appendix B
Accredited engineering programs by institution
- This listing of accredited programs includes only engineering programs that lead to a bachelor’s degree.
- Institutions listed have voluntarily requested that specific engineering programs be evaluated by the Accreditation Board. The terminology requested by the institution is shown.
- A single date which follows the name of a program indicates the year of the first graduating class for which accreditation applies. Accreditation applies to subsequent years and is still enforced.
- A double date following the name of a program indicates the period (inclusive of both years) for which the program was accredited. This may occur if the institution has discontinued the program under that specific name or has not requested renewal of accreditation or if the Accreditation Board has denied such renewal.
- The appearance of a third date indicates that accreditation has been renewed from that particular year on, after a time interval.
ALBERTA, UNIVERSITY OF
Edmonton, Alberta
Faculty of Engineering
- Agricultural Engineering: 1983-1995
- Chemical Engineering: 1965-
- Civil Engineering: 1965-
- Computer Engineering: 1983-
- Electrical Engineering: 1965-
- Engineering Physics: 1988-
- Materials Engineering: 1999-
- Mechanical Engineering: 1965-
- Metallurgical Engineering: 1965-2000
- Mineral Engineering: 1976-1982
- Mineral Process Engineering: 1983-1991
- Mining Engineering: 1965-1975, 1983-
- Petroleum Engineering: 1978-
BRITISH COLUBIA, THE UNIVERSITY OF
Vancouver, British Columbia
Faculty of Applied Science
- Agricultural Engineering: 1965-1978
- Bio-Resource Engineering: 1979-2001
- Chemical Engineering: 1965-
- Chemical and Biological Engineering: 2003-
- Civil Engineering: 1965-
- Computer Engineering: 2000-
- Electrical Engineering: 1965-
- Engineering Physics 1965-
- Environmental Engineering
- (jointly with Northern British Columbia): 2007-
- Geological Engineering: 1965-
- Integrated Engineering: 2003-
- Materials Engineering: 2006-
- Mechanical Engineering: 1965-
- Metallurgical Engineering: 1965-1987
- Metals and Materials Engineering: 1988-2005
- Mineral Engineering: 1965-1979
- Mining and Mineral Process Engineering: 1980-2005
- Mining Engineering: 2004-
BRITISH COLUMBIA-OKANAGAN, THE UNIVERSITY OF
Kelowna, British Columbia
Faculty of Applied Science
- Civil Engineering: 2011-
- Electrical Engineering: 2011-
- Mechanical Engineering: 2011-
BRITISH COLUMBIA INSTITUE OF TECHNOLOGY
Burnaby, British Columbia
School of Construction and the Environment
- Civil Engineering: 2011-
School of Energy
- Electrical Engineering: 2011-
CALGARY, THE UNIVERSITY OF
Calgary, Alberta
Schulich School of Engineering
- Chemical Engineering: 1969-
- Civil Engineering: 1969-
- Computer Engineering: 2002-
- Electrical Engineering: 1969-
- Geomatics Engineering: 1996-
- Manufacturing Engineering: 1997-
- Mechanical Engineering: 1969-
- Oil and Gas Engineering: 2001-
- Software Engineering: 2002-
- Surveying Engineering: 1982-1997
CARLETON UNIVERSITY
Ottawa, Ontario
Faculty of Engineering and Design
- Aerospace Engineering: 1992-
- Architectural Conservation and
- Sustainability Engineering 2015-
- Biomedical and Electrical Engineering: 2011-
- Biomedical and Mechanical Engineering: 2012-
- Civil Engineering: 1965-
- Communications Engineering: 2002-
- Computer Systems Engineering: 1984-
- Electrical Engineering: 1965-
- Engineering Physics: 2003-
- Environmental Engineering: 1996-
- Mechanical Engineering: 1965-
- Software Engineering: 2003-
- Sustainable and Renewable Energy Engineering: 2012-
CONCORDIA UNIVERSITY
Montréal, Québec
(formerly Sir George Williams University, 1959-1974)
Faculty of Engineering and Computer Science
- Building Engineering: 1982-
- Civil Engineering: 1969-
- Computer Engineering: 1983-
- Electrical Engineering: 1969-
- Industrial Engineering: 1995-
- Mechanical Engineering: 1969-
- Software Engineering: 2002-
CONESTOGA COLLEGE
Kitchener, Ontario
School of Engineering and Information Technology
- Electronic Systems Engineering: 2014-
- Mechanical Systems Engineering: 2011-
DALHOUSIE UNIVERSITY
Halifax, Nova Scotia
(formerly Dal Tech, 1997-200 and Technical University of Nova Scotia, 1981-1997 and Nova Scotia Technical College, 1907-1980)
Faculty of Engineering
- Agricultural Engineering: 1974-2000
- Biological Engineering: 1997-2014
- Chemical Engineering: 1965-
- Civil Engineering: 1965-
- Computer Engineering: 2006-2014
- Core Program: 1980-
- Electrical Engineering: 1965-
- Engineering Physics: 1987-1991
- Environmental Engineering: 2006-
- Industrial Engineering: 1969-
- Materials Engineering: 2005-
- Mechanical Engineering: 1965-
- Metallurgical Engineering: 1965-1977, 1981-2005
- Mineral Resources Engineering: 2007-
- Mining Engineering: 1965-2006
ÉCOLE DE TECHNOLOGIE SUPÉRIEURE
Montréal, Québec
(affiliated with l’Université du Québec)
- Génie de la construction: 1993-
- Génie des opérations et de la logistique: 2008-
- Génie des technologies de l’information: 2006-
- Génie et gestion de la construction: 1990-1996
- Génie électrique: 1990-
- Génie logiciel: 2004-
- Génie mécanique: 1990-
- Génie de la production automatisée: 1990-
GUELPH, UNIVERSITY OF
Guelph, Ontario
School of Engineering
- Agricultural Engineering: 1973-1995
- Biological Engineering: 1973-
- Biomedical Engineering: 2014-
- Computer Engineering: 2014-
- Engineering Systems and Computing: 1994-
- Environmental Engineering: 1993-
- Food Engineering: 1993-2000
- Mechanical Engineering: 2013-
- Water Resources Engineering: 1973-
LAKEHEAD UNIVERSITY
Thunder Bay, Ontario
Faculty of Engineering
- Chemical Engineering: 1974-
- Civil Engineering: 1974-
- Electrical Engineering: 1974-
- Mechanical Engineering: 1974-
- Software Engineering: 2002-
LAURENTIAN UNIVERSITY
Sudbury, Ontario
School of Engineering
- Chemical Engineering: 2006-
- Extractive Metallurgical Engineering: 1987-2006
- Extractive Metallurgy: 1985-1986
- Mechanical Engineering: 2011-
- Mineral Resources Engineering: 1987-
- Mining Engineering: 1987-
LAVAL, UNIVERSITÉ
Québec, Québec
Faculté de foresterie, de géographie et de géomatique
- Génie du bois: 2002-
- Génie géomatique: 2007-
Faculté des sciences de l’agriculture et de l’alimentation
- Génie agroalimentaire: 1999-
- Génie agroenvironnemental: 2002-
- Génie alimentaire: 1997-
Faculté des sciences et de génie
- Génie chimique: 1965-
- Génie civil: 1965-
- Génie des eaux: 2009-
- Génie électrique: 1965-
- Génie géologique: 1965-
- Génie industriel: 2014-
- Génie informatique: 1993-
- Génie logiciel: 2006-
- Génie des matériaux et de la métallurgie: 1990-
- Génie mécanique: 1965-
- Génie métallurgique: 1965-1990
- Génie des mines et de la minéralurgie: 1990-
- Génie minier: 1965-1990
- Génie physique: 1965-
- Génie rural: 1973-2002
- Ingénierie/réhabilitation des infrastructure urbaines: 1999-
MANITOBA, THE UNIVERSITY OF
Winnipeg, Manitoba
Faculty of Engineering
- Agricultural Engineering: 1971-1998
- Biosystems Engineering: 1996-
- Civil Engineering: 1965-
- Computer Engineering: 1987-
- Electrical Engineering: 1965-
- Geological Engineering: 1965-2001
- Industrial Engineering: 1987-2005
- Manufacturing Engineering: 2003-2013
- Mechanical Engineering: 1965-
MCGILL UNIVERSITY
Montréal, Québec
Faculty of Agricultural and Environmental Sciences
- Bioresource Engineering: 2005-
Faculty of Engineering
Agricultural Engineering (Macdonald College): 1971-2006
- Chemical Engineering: 1965-
- Civil Engineering: 1965-
- Computer Engineering: 1993-
- Electrical Engineering: 1965-
- Materials Engineering: 2005-
- Mechanical Engineering: 1965-
- Metallurgical Engineering: 1965-2007
- Mining Engineering: 1965-
- Software Engineering: 2007-
MCMASTER UNIVERSITY
Hamilton, Ontario
Faculty of Engineering
- Ceramic Engineering: 1974-1998
- Chemical Engineering: 1965-
- Chemical Engineering & Bioengineering: 2006-
- Civil Engineering: 1989-
- Civil Engineering & Computer Systems: 1992-1995
- Civil Engineering & Engineering Mechanics: 1965-1988
- Computer Engineering: 1981-
- Electrical & Biomedical Engineering: 2006-
- Electrical Engineering: 1965-
- Engineering Physics: 1974-
- Manufacturing Engineering: 1982-2005
- Materials Engineering: 1990-
- Mechanical Engineering: 1965-
- Mechatronics Engineering: 2009-
- Metallurgical Engineering: 1965-1997
- Software Engineering: 2001-
MEMORIAL UNIVERSITY OF NEWFOUNDLAND
St. John’s, Newfoundland
Faculty of Engineering and Applied Science
- Civil Engineering: 1975-
- Computer Engineering: 2002-
- Electrical Engineering: 1975-
- Mechanical Engineering: 1975-
- Naval Architectural Engineering: 1986-1996
- Ocean and Naval Architectural Engineering: 1997-
- Process Engineering: 2013-
- Shipbuilding Engineering: 1982-1985
MONCTON, UNIVERSITÉ DE
Moncton, Nouveau-Brunswick
Faculté d’ingénierie
- Génie civil: 1972-
- Génie électrique: 1998-
- Génie industriel: 1975-2009
- Génie mécanique: 1990-
NEW BRUNSWICK, UNIVERSITY OF
Fredericton, New Brunswick
Faculty of Computer Science and Faculty of Engineering
Software Engineering: 2006-
Faculty of Engineering
- Chemical Engineering: 1965-
- Civil Engineering: 1965-
- Computer Engineering: 2001-
- Electrical Engineering: 1965-
- Forest Engineering: 1972-
- Geological Engineering: 1984-
- Geomatics Engineering: 1999-
- Mechanical Engineering: 1965-
- Surveying Engineering: 1972-1999
NORTHERN BRITISH COLUMBIA, UNIVERSITY OF
Prince George, British Columbia
College of Science and Management
- Environmental Engineering
- (jointly with British Columbia): 2007-
NOVA SCOTIA TECHNICAL COLLEGE
(see Dalhousie University)
NSTC offered accredited engineering programs from 1965 to 1980.
NOVA SCOTIA, TECHNICAL UNIVERSITY OF
(see Dalhousie University)
ONTARIO INSTITUTE OF TECHNOLOGY, UNIVERSITY OF
Oshawa, Ontario
Faculty of Engineering and Applied Science
- Automotive Engineering: 2009-
- Electrical Engineering: 2009-
- Manufacturing Engineering: 2007-
- Mechanical Engineering: 2008-
- Nuclear Engineering: 2007-
- Software Engineering: 2009-
Faculty of Energy Systems and Nuclear Science
- Nuclear Engineering: 2007-
OTTAWA, UNIVERSITY OF
Ottawa, Ontario
Faculty of Engineering
- Biomedical Mechanical Engineering: 2009-
- Chemical Engineering: 1965-
- Civil Engineering: 1971-
- Computer Engineering: 1990-
- Electrical Engineering: 1965-
- Mechanical Engineering: 1971-
- Software Engineering: 2001-
POLYTECHNIQUE, ÉCOLE
Montréal, Québec
(affiliated with l’Université de Montréal)
- Génie aérospatial: 2012-
- Génie biomédical: 2012-
- Génie chimique: 1965-
- Génie civil: 1965-
- Génie électrique: 1965-
- Génie géologique: 1965-
- Génie industriel: 1973-
- Génie informatique: 1989-
- Génie logiciel: 2005-
- Génie des matériaux: 1990-2012
- Génie mécanique: 1965-
- Génie métallurgique: 1965-1989
- Génie des mines: 1991-
- Génie minier: 1965-1991
- Génie physique: 1965-
QUÉBEC EN ABITBI-TEMISCAMINGUE, UNIVERSITÉ DU
Rouyn-Noranda, Québec
Unité d’enseignement et de recherche en sciences appliquées
- Génie électromécanique: 2000-
- Génie mécanique: 2011-
QUÉBEC À CHICOUTIMI, UNIVERSITÉ DU
Chicoutimi, Québec
Department des sciences appliquées
- Génie civil: 2012-
- Génie électrique: 2004-
- Génie géologique: 1983-
- Génie informatique: 1992-
- Génie mécanique: 2004-
- Génie unifié: 1981-2009
- Ingénierie de l’aluminium: 2008-2012
QUÉBEC À CHICOUTIMI, UNIVERSITÉ DU
Chicoutimi, Québec
Département des sciences appliquées
- Génie civil: 2012-
- Génie électrique: 2004-
- Génie géologique: 1983-
- Génie informatique: 1992-
- Génie mécanique: 2004-
- Génie unifié: 1981-2009
- Ingénierie de l’aluminum: 2008-2012
QUÉBEC À MONTRÉAL, UNIVERSITÉ DU
Montréal, Québec
Faculté des sciences
- Génie microélectronique: 2007-
QUÉBEC EN OUTAOUAIS, UNIVERSITÉ DU
Gatineau, Québec
(formerly Québec a Hull, Université du)
Module de l’ingénierie
- Génie informatique: 2002-
QUÉBEC À RIMOUSKI, UNIVERSITÉ DU
Rimouski, Québec
Module de génie
- Génie des systèmes électromécaniques: 1998-
- Génie électrique: 2009-
- Génie mécanique: 2009-
QUÉBEC À TROIS-RIVIÈRES, UNIVERSITÉ DU
Trois-Rivières, Québec
École d’ingénieure
- Génie chimique: 1990-
- Génie électrique: 1978-
- Génie industriel: 1980-
- Génie mécanique manufacturier: 1987-1999
- Génie mécanique: 2000-
QUEEN’S UNIVERSITY
Kingston, Ontario
Faculty of Applied Science
- Chemical Engineering: 1965-
- Civil Engineering: 1965-
- Computer Engineering: 2002-
- Electrical Engineering: 1965-
- Engineering Chemistry: 1979-
- Engineering Physics: 1965-
- Geological Engineering: 1975-
- Materials and Metallurgical Engineering: 1992-2002
- Mathematics and Engineering: 1974-
- Mechanical Engineering: 1965-
- Metallurgical Engineering: 1965-1991
- Mining Engineering: 1965-
REGINA, UNIVERSITY OF
Regina, Saskatchewan
Faculty of Engineering and Applied Science
- Electronic Information Systems Engineering: 1986-1994
- Electronic Systems Engineering: 1995-
- Environmental Systems Engineering: 1997-
- Industrial Systems Engineering: 1984-
- Petroleum Systems Engineering: 2003-
- Regional Environmental Systems Engineering: 1990-1997
- Regional Systems Engineering: 1984-1989
- Software Systems Engineering: 2007-
- Systems Engineering: 1981-1983
ROYAL MILITARY COLLEGE OF CANADA
Kingston, Ontario
Faculty of Engineering
- Aeronautical Engineering: 2009-
- Chemical Engineering: 1965-1981, 2001-
- Chemical and Materials Engineering: 1992-2001
- Civil Engineering: 1965-
- Computer Engineering: 1983-
- Electrical Engineering: 1965-
- Engineering and Management: 1972-1995
- Engineering Physics: 1975-1995
- Fuels and Materials Engineering: 1982-1991
- Mechanical Engineering: 1965-
RYERSON POLYTECHNICAL INSTITUTE
(see Ryerson University)
- RPI offered accredited engineering programs in 1992.
RYERSON POLYTECHNICA UNIVERSITY (RPU)
(see Ryerson University)
- RPU offered accredited engineering programs from 1992 to 2002.
RYERSON UNIVERSITY
Toronto, Ontario
(formerly Ryerson Polytechnical institute, 1964-1992, and Ryerson Polytechnic University, 1992-2002)
Faculty of Engineering, Architecture and Science
- Aerospace Engineering: 1992-
- Biomedical Engineering: 2012-
- Chemical Engineering: 1992-
- Civil Engineering: 1992-
- Computer Engineering: 2006-
- Electrical Engineering: 1992-
- Industrial Engineering: 1992-
- Mechanical Engineering: 1992-
SASKATCHEWAN, UNIVERSITY OF
Saskatoon, Saskatchewan
College of Engineering
- Agricultural Engineering: 1965-1992
- Agricultural and Bioresource Engineering: 1992-
- Chemical Engineering: 1965-
- Civil Engineering: 1965-
- Computer Engineering: 2009-
- Electrical Engineering: 1965-
- Engineering Physics: 1965-
- Environmental Engineering: 2011-
- Geological Engineering: 1965-
- Geological Engineering (Geophysics): 1975-1999
- Mechanical Engineering: 1965-
- Mining Engineering: 1974-1976
SHERBROOKE, UNIVERSITÉ DE
Sherbrooke, Québec
Faculté de génie
- Génie biotechnologique: 2008-
- Génie chimique: 1973-
- Génie civil: 1965-
- Génie électrique: 1965-
- Génie informatique: 1997-
- Génie mécanique: 1965-
SIMON FRASER UNIVERSITY
Burnaby, British Columbia
School of Engineering Science
- Engineering Science: 1986-
- Mechatronic Systems Engineering: 2011-
SIR GEORGE WILLIAMS UNIVERSITY (SGW)
(see Concordia University)
SGW offered accredited engineering programs from 1969 to 1974.
TORONTO, UNIVERSITY OF
Toronto, Ontario
Faculty of Applied Science and Engineering
- Chemical Engineering: 1965-
- Civil Engineering: 1965-
- Computer Engineering: 1994-
- Electrical Engineering: 1965-
- Engineering Science: 1965-
- Geo-Engineering: 1983-1990
- Geological Engineering: 1965-1974
- Geological Engineering & Applied Earth Science: 1975-1982
- Geological and Mineral Engineering: 1991-1998
- Industrial Engineering: 1965-
- Materials Engineering: 1996-
- Mechanical Engineering: 1965-
- Metallurgical Engineering and Materials Science:1986-1995
- Metallurgy & Materials Science: 1965-1985
- Mineral Engineering: 1999-
VICTORIA, UNIVERSITY OF
Victoria, British Columbia
Faculty of Engineering
- Computer Engineering: 1988-
- Electrical Engineering: 1988-
- Mechanical Engineering: 1992-
- Software Engineering: 2007-
WATERLOO, UNIVERSITY OF
Waterloo, Ontario
Faculty of Engineering
- Chemical Engineering: 1965-
- Civil Engineering: 1965-
- Computer Engineering: 1989-
- Electrical Engineering: 1965-
- Environmental Engineering: 1999-
- Geological Engineering: 1986-
- Management Engineering: 2012-
- Mechanical Engineering: 1965-
- Mechatronics Engineering: 2008-
- Nanotechnology Engineering: 2011-
- Software Engineering: 2006-
- Systems Design Engineering: 1974-
WESTERN ONTARIO, THE UNIVERSITY OF
London, Ontario
Faculty of Engineering
- Chemical Engineering: 1965-1971, 2007-
- Chemical and Biochemical Engineering: 1972-2006
- Civil Engineering: 1965-
- Computer Engineering: 2001-
- Electrical Engineering: 1965-
- Green Process Engineering: 2012-
- Integrated Engineering: 2001-
- Materials Engineering: 1968-1999
- Mechanical Engineering: 1965-
- Mechatronic Systems Engineering: 2014-
- Software Engineering: 2001-
WINDSOR, UNIVERSITY OF
Windsor, Ontario
Faculty of Engineering
- Chemical Engineering: 1965-1990
- Civil Engineering: 1965-
- Electrical Engineering: 1965-
- Engineering Materials: 1974-1991
- Environmental Engineering: 1991-
- Geological Engineering: 1972-1989
- Industrial Engineering: 1974-
- Mechanical Engineering: 1965-
YORK UNIVERSITY
Toronto, Ontario
Faculty of Science and Engineering
- Computer Engineering: 2007-
- Geomatics Engineering: 2007-
- Space Engineering: 2007-
Appendix C
Canadian discipline categories as used in this report
This section provides a comprehensive listing of program titles, as provided by the post-secondary, which are currently offered at both the undergraduate (accredited) and postgraduate levels in Canada only. The “discipline” listing is the broad category within which a number of similar programs are grouped. While this report does not provide detailed data on individual programs, the information can be obtained by contacting Engineers Canada.
Discipline: Biosystems
Program
- Agricultural and Bioresource Engineering
- Bioresource Engineering
- Biological Engineering
- Biomedical Engineering
- Biomedical and Mechanical Engineering
- Biomedical Mechanical Engineering
- Biomedical: Computer Science
- Biosystems Engineering
- Chemical and Biological Engineering
- Forest Engineering
- Génie agroalimentaire
- Génie agroenvironnemental
- Génie alimentaire
- Génie biomédical
- Génie biotechnologique
Discipline: Civil
Program
- Architectural Conservation and Sustainability
- Architectural Engineering
- Building Engineering
- Civil Engineering
- Civil and Environmental Engineering
- Génie civil
- Génie de la construction
- Génie et gestion de la construction
- Infrastructure Protection and International Security
- Ingénierie/réhabilitation des infrastructures urbaines
Discipline: Electrical
Program
- Biomedical and Electrical Engineering
- Communications Engineering
- Controls Engineering
- Electrical Engineering
- Electrical and Computer Engineering
- Electrical and Biomedical Engineering
- Electronic Business Technologies
- Energy Systems Engineering
- Electro-mechanical Design
- Electronics Systems Engineering
- Génie des opérations et de la logistique
- Génie des technologies de l’information
- Génie des systèmes électromécaniques
- Génie électrique
- Génie électromécanique
- Génie énergétique
- Génie microélectronique
- Information Systems Security Engineering
- Quality Systems Engineering
- Sustainable Energy Engineering
Discipline: Geological
Program
- Génie géologique
- Geological Engineering
- Geological Engineering (Geophysics)
Discipline: Materials or Metallurgical
Program
- Génie des matériaux et de la métallurgie
- Génie des matériaux
- Génie métallurgique
- Ingénierie de l’aluminium
- Materials Engineering
- Mining/Materials Engineering
Discipline: Mining or Mineral
Program
- Génie des mines
- Génie des mines et de la minéralurgie
- Génie minéral
- Maîtrise en génie minéral
- Mineral Engineering
- Mining Engineering
- Mineral Resources Engineering
- Natural Resources Engineering
Discipline: Other
Program
- Aeronautical Engineering
- Aerospace Engineering
- Centre for Business, Entrepreneurship & Technology
- Civil and Geological Engineering
- Core Program
- Doctorat en ingénierie
- Doctorat en ressources minerals
- Engineering and Public Policy
- Engineering Design
- Engineering Management
- Engineering Systems and Computing
- Engineering Management
- Fire Protection Engineering
- Génie aérospatial
- Génie du bois
- Génie géomatique
- Génie nucléaire
- Génie papetier
- Génie sciences des pâtes et papiers
- Génie des technologies de l’information
- Génie unifié
- General Engineering
- Geodesy and Geomatics
- Geo-engineering
- Geomatics Engineering
- Green Process Engineering
- Information and Systems Engineering
- Integrated Engineering
- Management Engineering
- Management Sciences
- Nuclear Engineering
- Ocean and Naval Architectural Engineering
- Oil and Gas Engineering
- Petroleum Engineering
- Petroleum Systems Engineering
- Process Engineering
- Pulp & Paper Engineering
- Systems Design Engineering
- TIM (Systems)
- Technology Management
- Telecommunications Technical Management
Discipline: Chemical
Program
- Chemical and Petroleum Engineering
- Chemical Engineering
- Chemical Engineering and Bioengineering
- Génie biotechnologique
- Génie chimique
- Nanotechnology Engineering
Discipline: Computer
Program
- Computational Engineering and Science
- Computer Engineering
- Computer Networks Engineering
- Computer Systems Engineering
- Electronic Information Systems Engineering
- Electronic Systems Engineering
- Engineering Systems and Computing
- Génie informatique
- Human Computer Interaction
- Software Engineering and Game Design
- Systems – Electrical & Computer
Discipline: Engineering Physics
Program
- Engineering Chemistry
- Engineering Mathematics
- Engineering Physics
- Engineering Science
- Génie physique
- Mathematics and Engineering
- Mathématiques
Discipline: Environmental
Program
- Clean Energy Engineering
- Energy and Environment Systems
- Environmental Engineering
- Environmental Systems Engineering
- Génie des eaux
- Maîtrise en Science de la Terre
- Maîtrise en génie de l'environnement
- Sustainable & Renewable Energy
- Sciences de la Terre et de l’atmosphère
- Génie resources et systèmes
- Water Resources Engineering
Discipline: Industrial or Manufacturing
Program
- Advanced Design and Manufacturing Institute
- Advanced Manufacturing and Process Systems
- Électronique industrielle
- Génie de la production automatisée
- Génie des opérations et de la logistique
- Génie industriel
- Génie mécanique manufacturier
- Génie sécurité et hygiène industrielles
- Industrial Engineering
- Industrial Systems Engineering
- Mechanical Manufacturing Engineering
- Manufacturing Engineering
Discipline: Mechanical
Program
- Automotive Engineering
- Génie mécanique
- Mechanical Engineering
- Mechanical/Industrial Engineering
- Mechanical & Materials Engineering
- Mechanical & Manufacturing Engineering
- Mechanical & Mechatronic Engineering
- Mechanical Systems Engineering
- Mechatronics Engineering
- Mechatronic Systems Engineering
- Radiation Science Engineering
- Space Engineering
Discipline: Software
Program
- Génie logiciel
- Information Systems Science Engineering
- Software Engineering
- Software Engineering Entrance Program
- Software Engineering & Virtual Systems Design
- Software Systems Engineering
Year One/Two:
- Common First and Second Year
Common Year:
- Engineering Entrance
- Year One - Common
The discipline Engineering Science (E.Sci.) involves science-intensive studies in engineering physics, engineering bioscience, engineering chemistry and other specializations offered by universities with accredited engineering science programs.
Several universities in Canada have common first-year and, in some cases, second-year programs. Students in these programs do not declare a discipline of study in their first year or, as applicable, second year. The total number of students in common first-, second- and qualifying-year programs have been separated from the “Other” category, beginning with the 1997 data. This subdivision will be continued in future years.
Appendix D
Associated universities explained
Dalhousie University, Royal Military College of Canada (RMC), and Associated Universities
The bachelor of engineering degree awarded by Dalhousie University is normally conferred in association with one of several associated universities. The program of study is divided into two parts: the associated universities offer programs in engineering covering the ?rst part of the requirements for the degree and the Faculty of Engineering at Dalhousie offers courses in several departments of engineering covering the second part. There are other higher education institutions in Canada that operate under this model. Under the Accreditation Board's regulations for granting credits, a formally documented validation procedure must be in place.
Some of the associated universities include the following:
- Acadia University
- University of Cape Breton
- Dalhousie University
- Mount Allison University (as of 2000, no longer offering engineering programs)
- Nova Scotia Agricultural College
- St. Francis Xavier University
- Saint Mary’s University
Endnotes
- I.‘Accredited programs’ are programs that are recognized by the Accreditation Board as meeting the educational standard required by candidates for a professional engineering licence.
- This section and all following sections refer only to enrolment in currently accredited programs.
- Graduates of programs at this institution may have completed additional non-technical studies, such as a management or society option, that will be listed on their transcripts. These transcripts contain wording such as “(Discipline) Engineering and Society” or “(Discipline) Engineering and Management.” Only the engineering component of these programs is accredited by the Accreditation Board; thus, even though these options meet the accreditation requirements, only the base engineering programs are listed here.
- Graduates of programs at this institution may have completed additional non-technical studies, such as a management option, that will be listed on their degrees and transcripts. These degrees and transcripts contain wording such as “(Discipline) Engineering and Management.” Only the engineering component of these programs is accredited by the Accreditation Board; thus, even though these options meet the accreditation requirements, only the base engineering programs are listed here.
- Although reported under Engineering Physics, the SFU program is a broader Engineering Science program with multiple options—Biomedical Engineering, Computer Engineering, Electronics Engineering, Engineering Physics and Systems Engineering.