
Trends in engineering enrolment and degrees awarded 2018-2024
Message from the Chief Executive Officer

Engineers Canada is pleased to publish the 2025 edition of Canadian Engineers for Tomorrow, highlighting trends related to enrolment and degrees awarded in post-secondary engineering education in Canada. This document comprises information on all academic terms from the calendar years 2018 through 2024.
Canadian post-secondary institutions continue to report a strong growth in undergraduate degrees awarded, presenting 9.0 per cent more engineering degrees in 2024 than in 2018. It is once again positive to see that most engineering disciplines awarded more degrees in 2024 than in 2018, and that many engineering disciplines have experienced a growth in undergraduate enrolment numbers in the same period.
We are excited to report that the proportion of self-identified female students enrolled in undergraduate and postgraduate programs, as well as the proportion receiving undergraduate degrees, has reached an all-time high. As of 2024, self-identified females comprised 27.2 per cent of undergraduate students, 29.4 per cent of postgraduate students, and 25.0 per cent of undergraduate engineering degrees awarded. As the profession moves toward Engineers Canada’s 30 by 30 goal – where 30 per cent of newly licensed engineers are women by 2030 – this increasing representation at the undergraduate level is an important indicator of progress.
Meanwhile, Canadian engineering programs remain a popular choice for international students. In 2024, the number of international undergraduate students reached 14,467, or 16.0 per cent of total undergraduate engineering enrolment.
For the seventh time, Engineers Canada collected data regarding Indigenous students’ enrolment and degrees awarded. Indigenous people are still greatly underrepresented in engineering education, accounting for only 0.7 per cent of reported undergraduate students. This is around eight times lower than the 5.0 per cent of people in Canada who identify as Indigenous (Statistics Canada, 2021).
Engineers Canada will continue to track this information in the coming years to identify trends and to further encourage enrolment and achievement by post-secondary engineering programs that reflect Canada’s diversity.
Philip Rizcallah, P.Eng.
Chief Executive Officer
Acknowledgements
In preparing this report, Engineers Canada gratefully acknowledges the contribution of data and information from the deans and associate deans of the engineering and applied science faculties at Canadian higher education institutions.
Report by: Adam Rodrigues, FEC (Hon.), PMP
Introduction
Canadian Engineers for Tomorrow is an annual examination of Canada's undergraduate and postgraduate engineering programs. It evaluates trends in part- and full-time student enrolment and degrees awarded over a five-year period. In 2025, 43 higher education institutions provided information on their enrolment, programs, and degrees awarded.
The results highlight enrolment trends by discipline and institution, as well as the number of undergraduate and postgraduate degrees awarded each year. These results reveal trends specific to discipline, education level, gender, and international students’ participation in Canadian engineering education as well as the number of engineering graduates available to enter the labour market. Enrolment trends at the undergraduate, master’s, and doctoral levels are compared, along with self-identified male and female students studying and graduating from engineering programs. For the seventh time, data regarding Indigenous peoples’ enrolment and graduation from engineering programs is presented in this report. Engineers’ Canada plans to continue collecting this data in coming years to be able to identify emerging trends.
Data is provided by higher education institutions to Engineers Canada and compiled for this report. Findings are then shared with stakeholders in engineering across Canada and the public in the form of this report. Engineers Canada greatly appreciates the contribution of the higher education institutions to this work.
Notes to the reader
- When comparing data between years, only those higher education institutions who consistently responded to the survey year-after-year are included in the comparison. If an institution did not provide data in one or more of those years, they were not included in the comparison. This is done to ensure that the comparisons are fair and as accurate as possible. Small inaccuracies in the reported data, as well as changes in programming, will affect the percentages presented throughout the report.
- Four program types were re-classified from engineering physics to the "other" category, affecting a total of six engineering programs. Though it may appear that there is an increase in the percentage of enrolment and degrees awarded, this is only a consequence of the reclassification and does not reflect any actual increases in those programs that are part of the other category.
- Sex identifiers have been limited to ‘male’, ‘female’, ‘non-binary’, and ‘prefer not to specify’". We use ‘female-identified’ to describe individuals who self-identified as female and ‘male-identifying’ to describe individuals who self-identified as male, to limit the conflation of sex and gender and acknowledge the gender diversity that exists within these sex identities.
Undergraduate students
Total undergraduate student enrolment
Undergraduate student enrolment in accredited engineering programs totalled 90,306 in 2024. This is an increase of 1.0 per cent from 2018 and a 6.0 per cent increase from 2022.
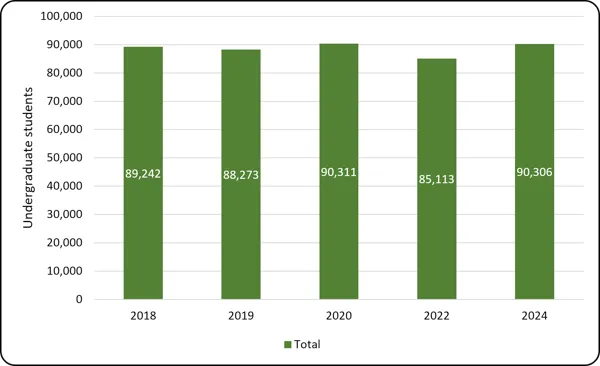
Chart 1.1 - Undergraduate enrolment (2018-2024, full-time equivalent)
Total undergraduate student enrolment by discipline
The undergraduate engineering disciplines with the highest enrolment in 2024 were mechanical engineering, civil engineering, and electrical engineering. These represent 22.1 per cent, 12.8 per cent, and 11.2 per cent of total undergraduate enrolment, respectively. Conversely, the fields that accounted for the smallest proportion of undergraduate enrolment were materials or metallurgical engineering (1.0 per cent), mining or mineral engineering (0.8 per cent), and geological engineering (0.5 per cent).
Software (19.8 per cent), computer engineering (17.0 per cent) and environmental (16.9 per cent) demonstrated the highest growth since the previous year. Similarly, the disciplines that experienced the largest cumulative growth from 2018 were other (102.1 percent), computer engineering (48.3 per cent), and software engineering (44.8 per cent). Conversely, materials or metallurgical (-45.5 per cent), engineering physics (-34.7 per cent), and geological engineering (‑13.6 per cent) had the largest decline from the previous year.
Nine disciplines experienced a decline in enrolment since 2018: engineering physics (-49.0 per cent), mining or mineral engineering (-34.3 per cent), chemical engineering (-24.4 per cent), geological engineering (-20.9 per cent), electrical engineering (-16.6 per cent), civil engineering (‑11.3 per cent), industrial or manufacturing engineering (-8.0 per cent), mechanical engineering (-1.6 per cent) and material or metallurgical engineering (-0.8 per cent). Once again, these comparisons were made between institutions that consecutively replied to the enrolment and degrees awarded survey since 2018.
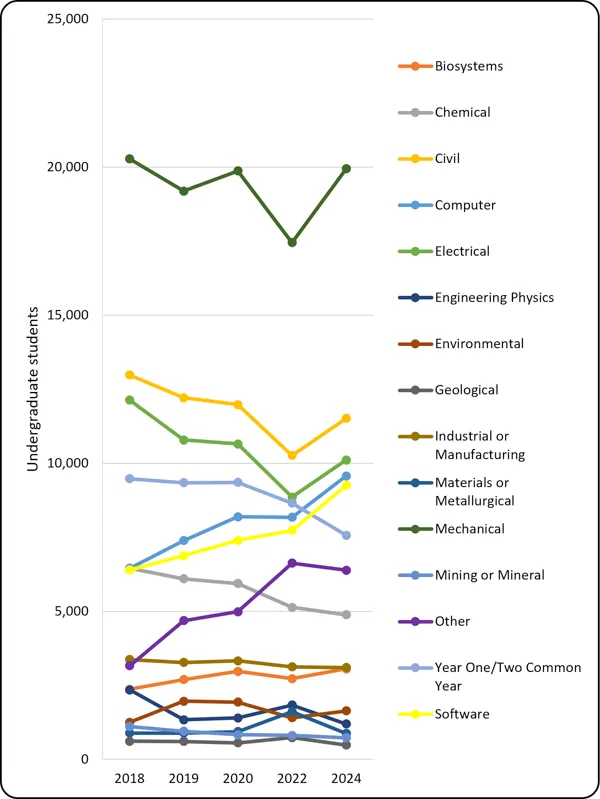
Chart 1.2 - Undergraduate enrolment by program (2018-2024, full-time equivalent)
Total undergraduate student enrolment by province
The highest proportion of undergraduate enrolment continues to be in Ontario and Quebec. In 2024, these provinces accounted for 48.1 per cent and 27.2 per cent of total enrolment, respectively. Furthermore, New Brunswick (22.7 per cent), Manitoba (22.6 per cent) and Ontario (22.6 per cent) underwent the largest percentage increase in enrolment from the previous year.
The highest cumulative enrolment growth from 2018 occurred in British Columbia (40.3 per cent) and Manitoba (24.3 per cent).
Alberta (-56.5), Newfoundland and Labrador (-43.1), Saskatchewan (-33.7 per cent), and Prince Edward Island (-3.6%) were the only provinces to experience a decrease from the previous year. Alberta (-54.6 per cent), Newfoundland and Labrador (-48.7), Saskatchewan (-44.2 per cent), Nova Scotia (-23.5%), and Quebec (-9.2 per cent) were the provinces to experience a decrease in enrolment since 2018. Once again, these comparisons were made between institutions that consecutively replied to the enrolment and degrees awarded survey since 2018.
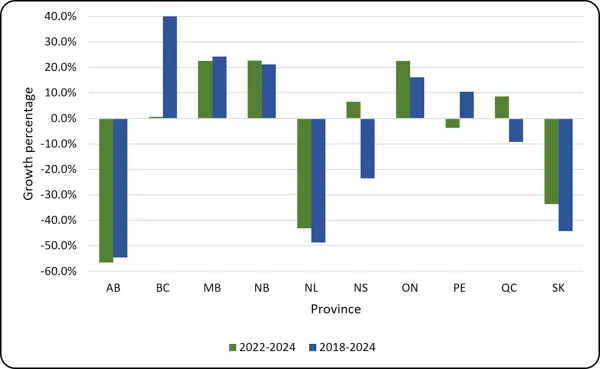
Chart 1.3 - Average growth in undergraduate enrolment by province (2018-2024, 2022-2024, full-time equivalent)
Total undergraduate degrees awarded
The number of undergraduate degrees awarded totalled 17,976 in 2024, which is an increase of 4.8 per cent from the previous year. This aligns with the average annual increase of 2.7 per cent for the period of 2018 to 2024. Cumulatively, the number of degrees awarded across Canada has increased 9.0 per cent from 2018. Once again, these comparisons were made between institutions that consecutively replied to the enrolment and degrees awarded survey since 2018.
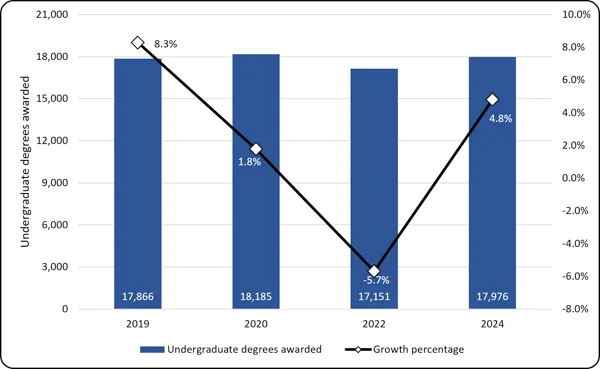
Chart 1.4 - Undergraduate degrees awarded (2018-2024)
Chart 1.5 shows that Prince Edward Island and Ontario had the highest increases in undergraduate degrees awarded from 2022, growing 33.3 per cent and 11.8 per cent, respectively. Similarly, Prince Edward Island, British Columbia, Ontario, and Alberta experienced the highest increases in undergraduate degrees awarded from 2018, with growth of 205.9 per cent, 32.7 per cent, 16.2 per cent, and 10.2 per cent, respectively.
Saskatchewan (-10.5 per cent), Nova Scotia (-8.0 per cent), New Brunswick (-7.6 per cent), Manitoba (-6.9 per cent), and Quebec (-5.0 per cent) experienced decreases in undergraduate degrees awarded from the previous year. Saskatchewan (-35.8 per cent), New Brunswick (-26.7 per cent), Manitoba (-10.8 per cent) and Nova Scotia (-1.7 per cent) reported a decrease in degrees awarded since 2018. Once again, these comparisons were made between institutions that consecutively replied to the enrolment and degrees awarded survey since 2018.
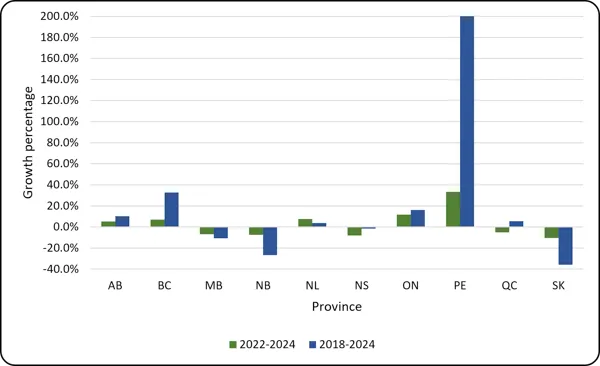
Chart 1.5 - Average growth in undergraduate degrees awarded by province (2022-2024, 2018-2024)
Mechanical engineering, civil engineering, and electrical engineering awarded the greatest number of degrees in 2024, representing 24.4 per cent, 15.5 per cent, and 12.1 per cent of the total, respectively. Furthermore, computer engineering exhibited the largest growth in degrees awarded from 2022 (23.0 per cent) and software engineering exhibited the largest growth in degrees awarded from 2018 (133.7 per cent).
Mining or mineral engineering (-49.5 per cent), geological engineering (-42.1 per cent), engineering physics (-30.5 per cent), chemical engineering (-25.2 per cent), materials or metallurgical engineering (-18.6 per cent), and electrical engineering (-1.8 per cent) were the disciplines that experienced decreases since 2018 in the number of undergraduate degrees awarded. Also, geological engineering (-36.0 per cent), mining or mineral engineering (-12.9 per cent), industrial or manufacturing (-4.7 per cent), chemical engineering (-3.7 per cent), and electrical engineering (-3.6 per cent) have seen decreases since 2022.
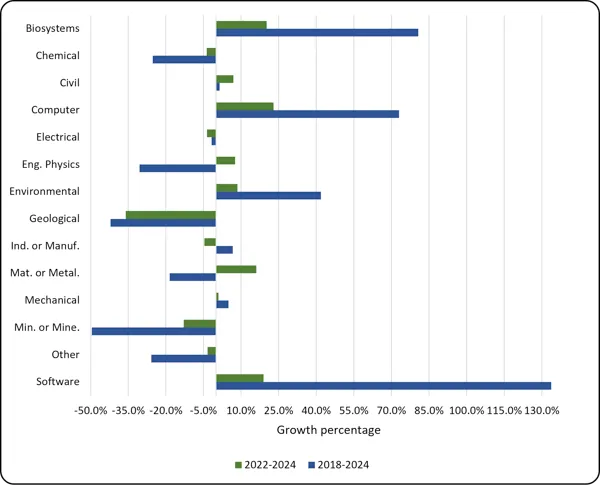
Chart 1.6 - Average growth in undergraduate degrees awarded by discipline (2022-2024, 2018-2024)
Postgraduate students
Total postgraduate student enrolment
Postgraduate student enrolment totalled 35,150 in 2024. When comparing institutions that consecutively replied to this survey since 2018, graduate student enrolment increased by 16.1 per cent from 2022 and 36.1 per cent from 2018, averaging an 8.1 per cent annual growth rate.
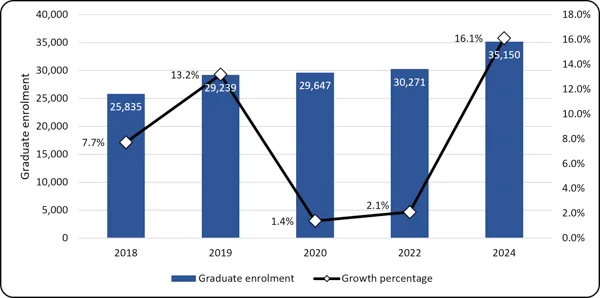
Chart 1.7 - Postgraduate student enrolment (2018-2024, full-time equivalent)
The province that experienced the highest growth in postgraduate enrolment over the previous year was Quebec (57.9 per cent). The province that displayed the highest cumulative growth since 2018 was British Columbia (54.1 per cent).
The provinces to experience a decrease from 2022 were Saskatchewan (-42.3 per cent), Alberta (‑38.8), Prince Edward Island (-26.2 per cent), Manitoba (-11.9 per cent), Nova Scotia (-11.5 per cent), New Brunswick (-9.2 per cent) and British Columbia (-0.9 per cent). Similarity, Saskatchewan (-46.0), Alberta (-22.1 per cent) and Prince Edward Islands (-19.0 per cent) had a decrease in postgraduate enrolment. Once again, these comparisons were made between institutions that consistently reported to the enrolment and degrees awarded survey since 2018.
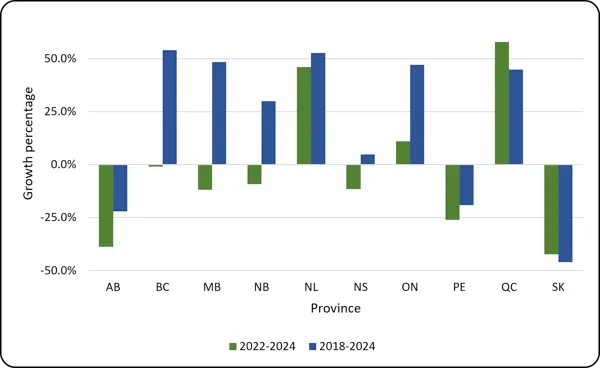
Chart 1.8 - Average rate of change in postgraduate student enrolment by province (2022-2024, 2018-2024, full-time equivalent)
Total postgraduate degrees awarded
A total of 12,754 master’s and 1,887 doctoral of engineering degrees were awarded in 2024, for a combined total of 14,641 postgraduate degrees. This corresponds to a growth of 26.6 per cent in master’s degrees awarded and an increase of 14.2 per cent in doctoral degrees awarded from 2022. There has been a cumulative growth of 64.3 per cent in master’s degrees awarded and 19.9 per cent in doctoral degrees awarded since 2018.
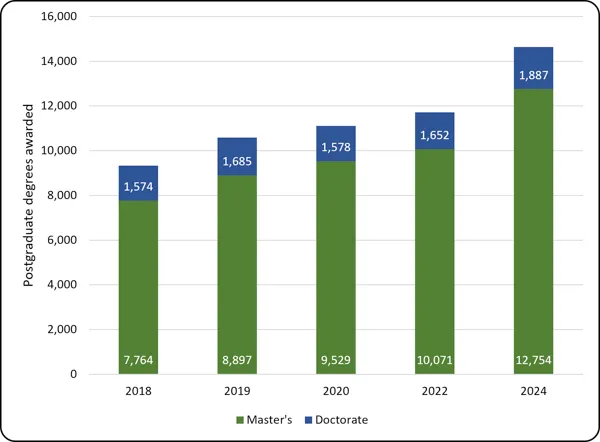
Chart 1.9 - Postgraduate degrees awarded (2018-2024)
Prince Edward Island had the largest growth in the number of master’s degrees awarded in 2024 (100.0 per cent) and had the largest growth since 2018 (700.0 per cent).
Chart 1.10 indicates the average growth in master’s degrees awarded by province for the periods of 2018 to 2024 and 2022 to 2024, while Chart 1.11 indicates the same data for doctoral degrees. Once again, these comparisons were made between institutions that consecutively replied to the enrolment and degrees awarded survey since 2018.
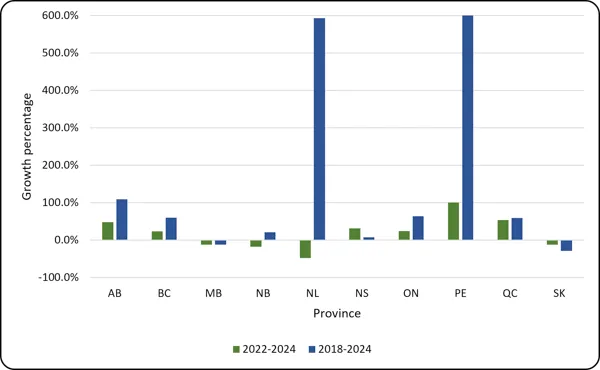
Chart 1.10 – Average growth in master’s degrees awarded by province (2022-2024, 2018-2024)
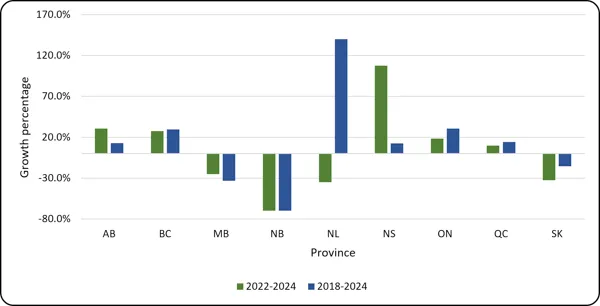
Chart 1.11 – Average growth in doctoral degrees awarded by province (2022-2024, 2018-2024)
Female-identified students
Female-identified undergraduate enrolment
Female-identified undergraduate enrolment remained above 25 per cent in 2024, with a 2.0 per cent increase from 25.2 per cent in 2022 to 27.2 per cent in 2024. The total number of self-identified females enrolled in undergraduate-level engineering programs has decreased by 1.9 per cent since 2022 and increased 9.5 per cent since 2018.
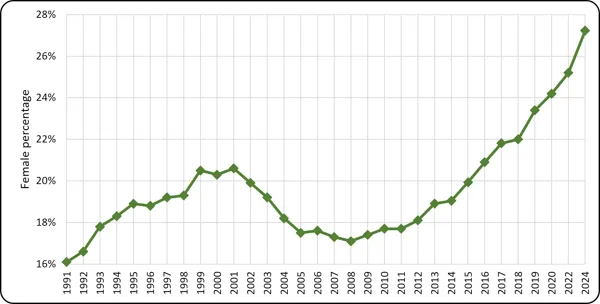
Chart 2.1 – Female-identified undergraduate enrolment (1991-2024, full-time equivalent)
Female-identified undergraduate enrolment by discipline
The disciplines that experienced the highest proportion of female-identified undergraduate enrolment in 2024 were biosystems engineering (56.6 per cent), chemical engineering (45.8 per cent), and geological engineering (42.1 per cent).
The disciplines with the lowest percentages of female-identified undergraduate enrolment were mechanical engineering (18.9 per cent), electrical engineering (19.1 per cent), computer engineering (19.6 per cent), and mining or mineral engineering (20.3 per cent). While these four disciplines account for 44.7 per cent of the total number of undergraduate students, they only account for 31.0 per cent of the total number of female-identified undergraduate students.
Furthermore, the disciplines that experienced the highest growth in the proportion of female-identified students from 2022 were software engineering, civil engineering and mechanical engineering which rose 39.8 per cent, 38.9 per cent, and 23.8 per cent, respectively.
Similarly, the disciplines that experienced the highest growth in the proportion of female-identified students from 2018 were software engineering, computer engineering, and biosystems engineering, which rose 123.3 per cent, 85.5 per cent and 47.7 per cent, respectively.
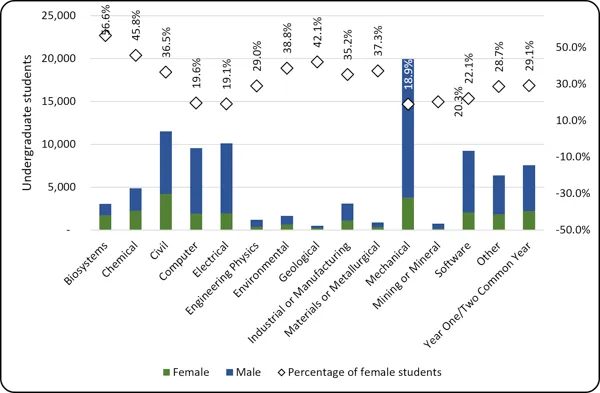
Chart 2.2 – Female-identified undergraduate enrolment by discipline (2024, full-time equivalent)
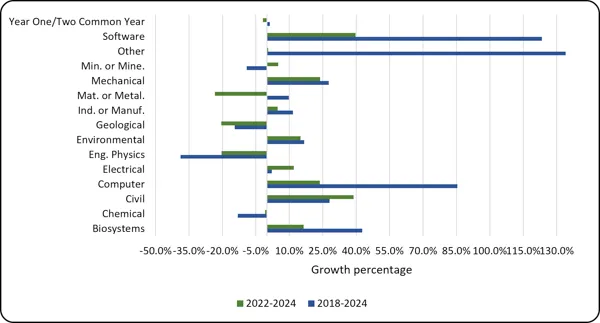
Chart 2.3 - Average growth in female-identified undergraduate enrolment by discipline (2022-2024, 2018-2024, full-time equivalent)
Female-identified undergraduate enrolment by province
Ontario had the highest percentage of female-identified undergraduate students (29.8 per cent), while Saskatchewan had the lowest (21.3 per cent). As shown in Chart 2.5, seven provinces experienced increases in female-identified undergraduate enrolment since 2022, while six provinces experienced increases since 2018. Once again, these comparisons were made between institutions that consecutively replied to the enrolment and degrees awarded survey since 2018.
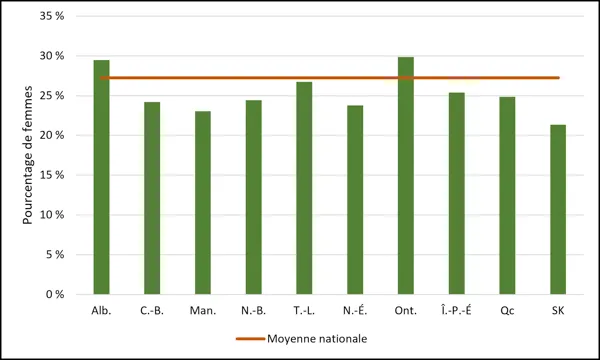
Chart 2.4 - Female-identified undergraduate student enrolment by province (2024, full-time equivalent)
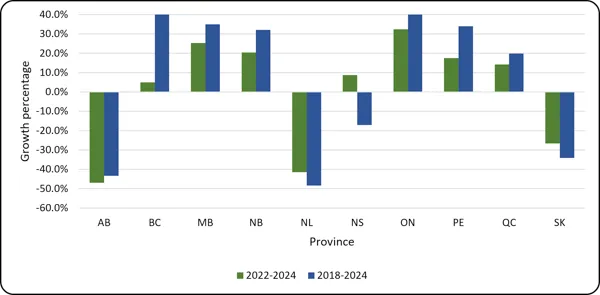
Chart 2.5 - Average growth in female-identified undergraduate student enrolment by province (2022-2024, 2018-2024, full-time equivalent)
Undergraduate degrees awarded to female-identified students
Of the 17,976 engineering degrees awarded in 2024, 4,491 were awarded to female-identified students, accounting for 25.0 per cent of the graduates. When comparing engineering programs that consecutively replied to this survey, increases of 12.3 per cent from 2024 and 28.8 per cent from 2018 were observed.
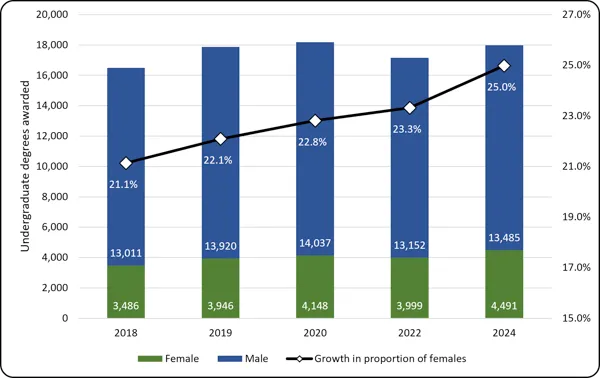
Chart 2.6 - Undergraduate degrees awarded to female-identified students (2018-2024)
The provinces with the highest proportion of undergraduate degrees awarded to female-identified students are Newfoundland and Labrador (26.9 per cent), followed by Ontario (26.6 per cent), and New Brunswick (25.4 per cent). Additionally, British Columbia had the greatest increase in the proportion of undergraduate degrees awarded to female-identified graduates when compared to 2022 with a growth of 3.9 percentage points overall.
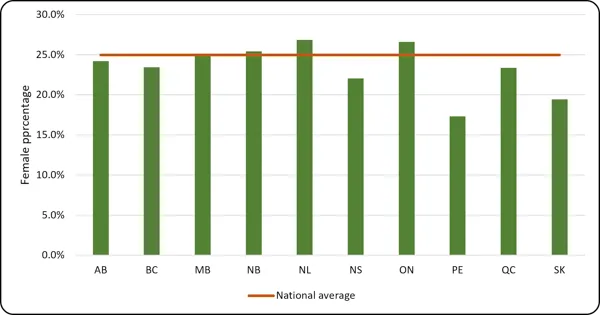
Chart 2.7 - Undergraduate degrees awarded to female-identified students by province (2024)
The disciplines that had the highest growth over the previous year in the proportion of undergraduate degrees awarded to female-identified graduates were that of biosystems engineering (10.2 percentage points increase) and geological engineering (9.0 percentage points increase). The categories that experienced the highest growth from 2018 were those of biosystems engineering (15.3 percentage points increase) and chemical engineering (6.8 percentage point increase).
If it is assumed that the proportion of female-identified students granted degrees matches pace with the number of female-identified students enrolled, the proportion of undergraduate degrees awarded to female-identified graduates will likely experience growth in the coming years due to the increase in the proportion of female-identified undergraduate enrolment in many engineering disciplines, as illustrated in Chart 2.3. This is particularly notable for disciplines experiencing the highest growth of female-identifying students, such as software engineering, computer engineering, and biosystems engineering.
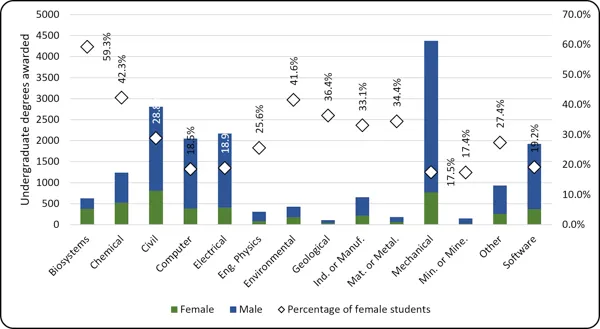
Chart 2.8 - Undergraduate degrees awarded to female-identified students by discipline (2024)
Female-identified postgraduate student enrolment
The proportion of female-identified students enrolled in postgraduate engineering programs continues to grow, reaching 29.4 per cent in 2024. When comparing institutions that consistently replied to this survey since 2018, an increase in proportion of 1.5 percentage points from 2022 and 3.2 percentage points from 2018 was observed.
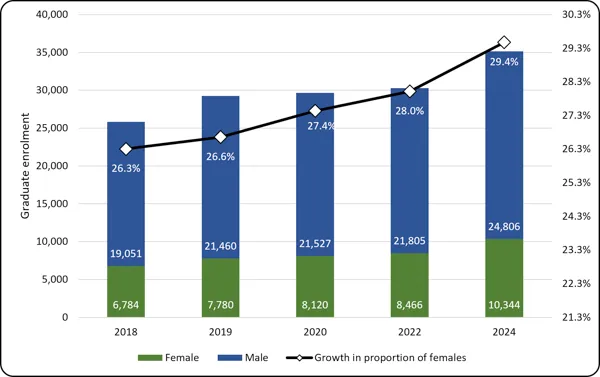
Chart 2.9 - Female-identified postgraduate student enrolment (2018-2024, full-time equivalent)
The highest proportions of female-identified postgraduate enrolment in 2024 were in Manitoba, Quebec, and British Columbia, with values of 31.8 per cent, 31.2 per cent, and 30.2 per cent, respectively.
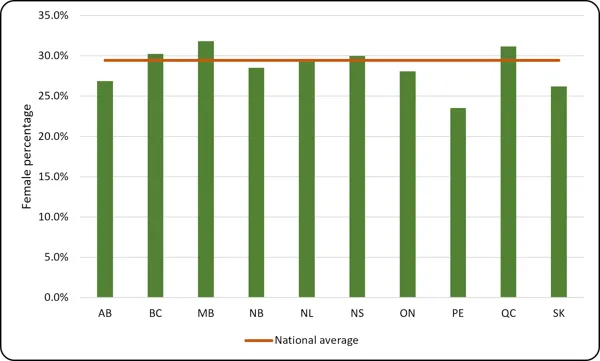
Chart 2.10 - Female-identified postgraduate student enrolment by province (2024, full-time equivalent)
Postgraduate degrees awarded to female-identified students
The number of postgraduate degrees awarded to female-identified students in 2024 consisted of 3,517 master’s degrees and 559 doctoral degrees. When compared to 2022, this represented a 3.2 per cent increase in the number of master's degrees awarded and a 14.9 per cent increase for doctoral degrees awarded. When comparing institutions that consistently replied to this survey since 2018, the proportion of master's degrees awarded to female-identified students has increased from 26.7 per cent in 2022 to 27.6 per cent in 2024. The proportion of doctoral degrees awarded to female-identified students also increased, from 25.8 per cent in 2022 to 29.6 per cent in 2024.
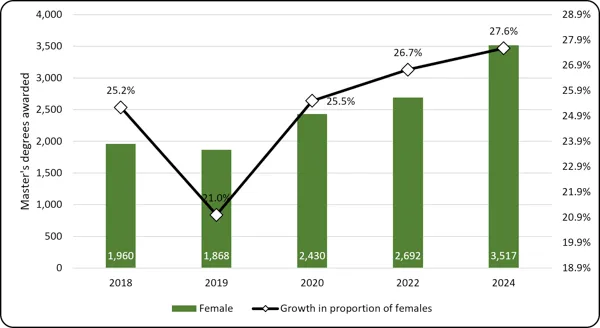
Chart 2.11 - Proportion of master’s degrees awarded to female-identified students (2018-2024)
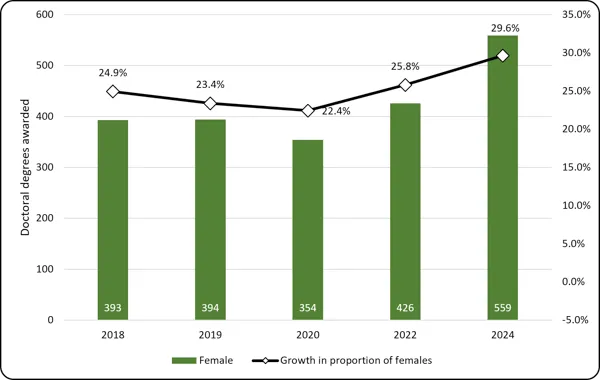
Chart 2.12 – Proportion of doctoral degrees awarded to female-identified students (2018-2024)
In 2024, the province with the largest proportion of master’s degrees awarded to female-identified students was New Brunswick, at 33.3 per cent. New Brunswick also had the greatest percentage of female-identified students awarded doctoral degrees at 66.7 per cent. Conversely, the province with the smallest proportion of master’s was Newfoundland and Labrador, at 21.0 per cent, and the province with the smallest proportion of doctoral degrees awarded to female-identified students was Prince Edward Island, at 0.0 percent.
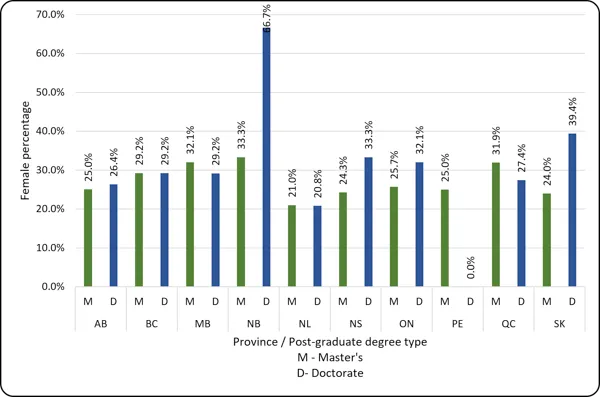
Chart 2.13 - Postgraduate degrees awarded to female-identified students by province (2024)
International students
International undergraduate enrolment
There were 14,467 international students enrolled in undergraduate engineering programs in 2024, accounting for 16.0 per cent of total enrolment. When comparing institutions that consecutively replied to this survey since 2018, international students represented 15.6 per cent of total undergraduate enrolment and represented 16.0 per cent in 2024. This means that the proportion of international students enrolled in undergraduate engineering programs has increased 2.6 per cent since 2018 but decreased 11.3 per cent from 2022 to 2024.
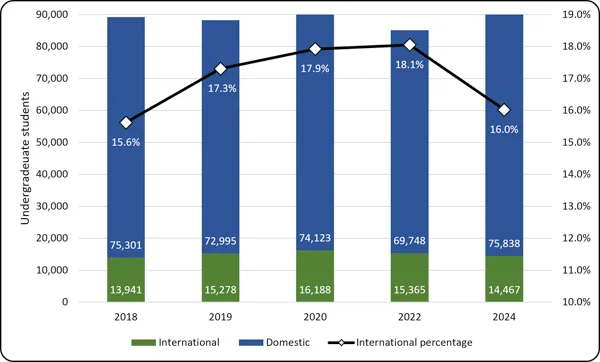
Chart 3.1 - International undergraduate enrolment (2018-2024, full-time equivalent)
International undergraduate enrolment by discipline
In 2024, the disciplines with the highest proportion of international students enrolled were materials or metallurgical engineering (32.3 per cent) and industrial or manufacturing (24.0 per cent). Conversely, the programs with the lowest proportion of international students were engineering physics and geological engineering, at 10.4 per cent and 8.1 per cent, respectively.
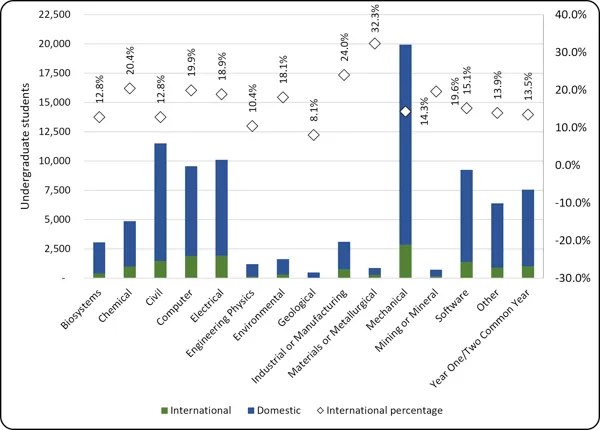
Chart 3.2 - International undergraduate enrolment by discipline (2024, full-time equivalent)
International undergraduate enrolment by province
Of the 14,467 international students enrolled in undergraduate engineering programs in Canada in 2024, 13.3 per cent (5,792 students) studied in Ontario and 17.9 per cent (4,402 students) studied in Quebec. Prince Edward Island and New Brunswick had the highest proportion of international students enrolled at 39.0 per cent (161 students) and 32.2 per cent (654 students), respectively. The largest growth in international student enrolment over the previous year occurred in New Brunswick (39.9 per cent) and Manitoba (20.6 per cent).
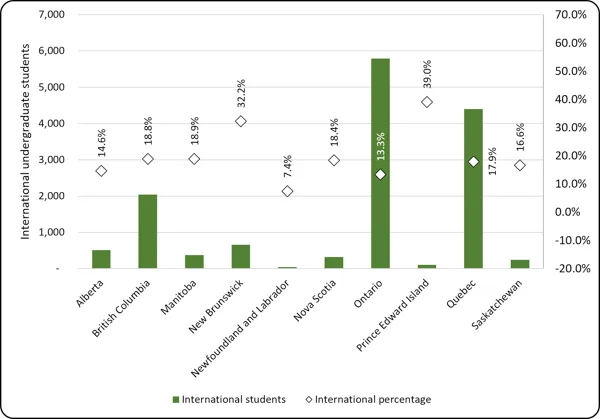
Chart 3.3 - International undergraduate enrolment by province (2024, full-time equivalent)
International undergraduate degrees awarded
In 2024, 2,987 of the 17,976 undergraduate degrees awarded were conferred on international students, representing 16.6 per cent overall. When comparing institutions that consecutively replied to this survey since 2018, the proportion of degrees awarded to international students has grown 13.5 per cent since 2018, and 2.1 percent since 2022.
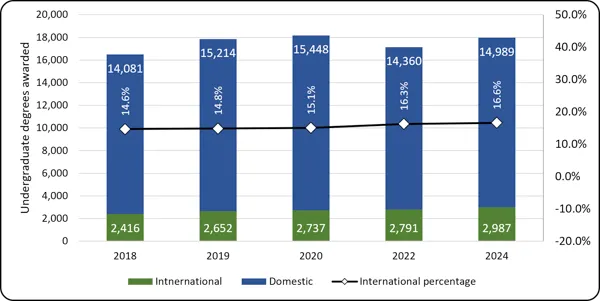
Chart 3.4 - Undergraduate degrees awarded to international students (2018-2024)
International postgraduate student enrolment
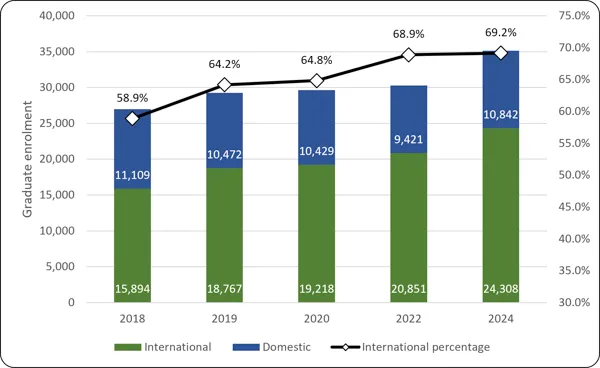
Chart 3.5 - International postgraduate student enrolment (2018-2024, full-time equivalent)
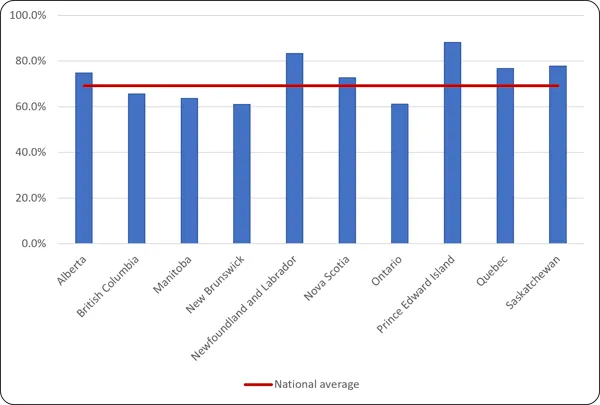
Chart 3.6 - International postgraduate student enrolment by province (2024, full-time equivalent)
International postgraduate degrees awarded
In 2024, the number of master's degrees awarded to international students totalled 10,122 and the number of doctoral degrees totalled 1,107. When comparing institutions that consecutively replied to this survey, master’s degrees awarded to international students increased by 17.4 percent since 2018 and 12.9 per cent over the previous year, while doctoral degrees awarded increased by 4.7 per cent since 2018, and decreased 3.5 per cent from 2022 to 2024.
The proportion of postgraduate degrees awarded to international students reached 79.4 per cent of all master's degrees and 58.7 per cent of all doctoral degrees in 2024. This represents growth from 2018, when the proportion of master's degrees awarded was 64.1 per cent and that of doctoral degrees awarded was 56.0 per cent.
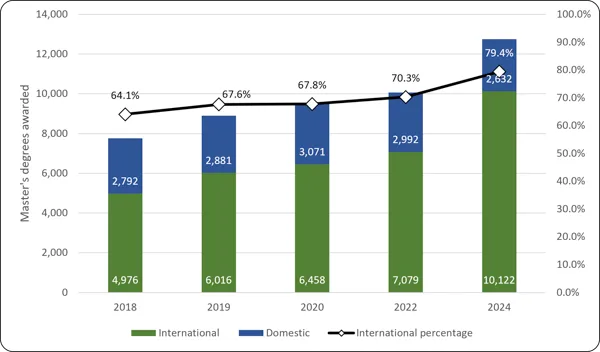
Chart 3.7 - Master’s degrees awarded to international students (2018-2024)
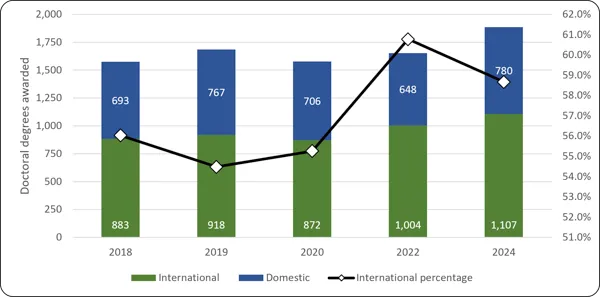
Chart 3.8 - Doctoral degrees awarded to international students (2018-2024)
In 2024, Newfoundland and Labrador, New Brunswick, and Nova Scotia had the greatest proportion of master's degrees awarded to international students at 93.4 per cent, 87.3 per cent, and 85.2 per cent, respectively. Similarly, Alberta, Quebec, and Saskatchewan awarded the greatest proportion of doctoral degrees to international students at 73.6 per cent, 70.2 per cent, and 63.6 per cent, respectively.
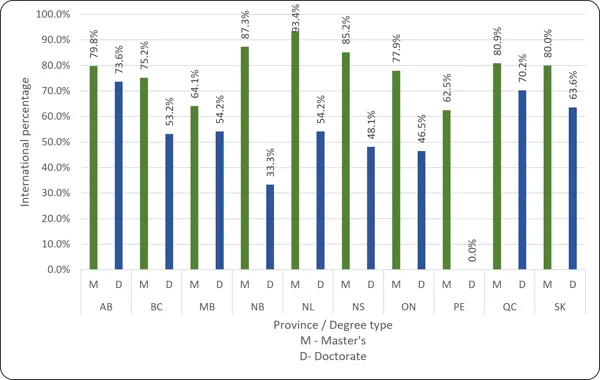
Chart 3.9 - Postgraduate degrees awarded to international students by province (2024)
Indigenous student enrolment and degrees awarded
Of the 43 institutions that responded to the enrolment and degrees awarded survey, 21 provided information about Indigenous students. As the reported numbers are of a small magnitude, the data on Indigenous student enrolment is presented in a cumulative form to assure anonymity. While not all institutions are able to report Indigenous identity of their students, this data assists the engineering community in pursuing conversations on increasing the representation of Indigenous people in engineering. Even if a comprehensive and true representation of Indigenous student enrolment and degrees awarded is not available at this time, the data here provides an important starting point.
Of the 21 institutions who provided data, 21 institutions provided information on undergraduate Indigenous student enrolment. The institutions providing this data represent 46.2 per cent of the total undergraduate enrolment in engineering programs in Canada. Twenty-one institutions, representing 41.9 per cent of total degrees awarded, provided information on undergraduate degrees awarded to Indigenous students. In addition, 11 institutions, representing 32.2 per cent of postgraduate student enrolment, provided data on Indigenous postgraduate student enrolment. Finally, seven institutions, representing 15.0 per cent of all postgraduate degrees awarded, provided data on Indigenous student postgraduate degrees awarded.
While Indigenous people make up 5.0 per cent of the population in Canada[1], Indigenous students only account for 0.7 per cent of total undergraduate enrolment in engineering programs and 0.7 per cent of undergraduate degrees awarded. Postgraduate student enrolment is 0.2 per cent of total enrolment, and 0.1 per cent of postgraduate degrees were awarded to Indigenous students.
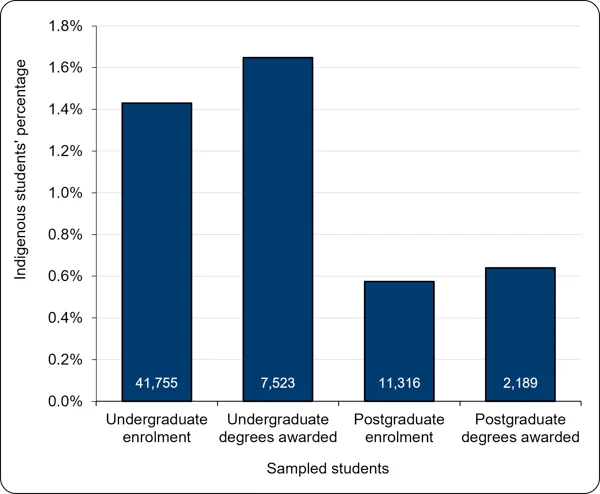
Chart 4.1 – Indigenous student undergraduate enrolment and degrees awarded (2024)
[1] Government of Canada. Indigenous population continues to grow and is much younger than the non-Indigenous population, although the pace of growth has slowed. The Daily, September 09,, 2022, https://www150.statcan.gc.ca/n1/daily-quotidien/220921/dq220921a-eng.htm
Faculty members
There was a total of 5,166 full-time equivalent engineering faculty members across Canada in 2024. When comparing institutions that consecutively replied to this survey since 2018, the number of full-time equivalent faculty members has increased by 3.6 per cent since 2022 and 10.0 per cent since 2018. The proportion of female-identified faculty increased from the previous year from 19.5 per cent to 19.7 per cent.
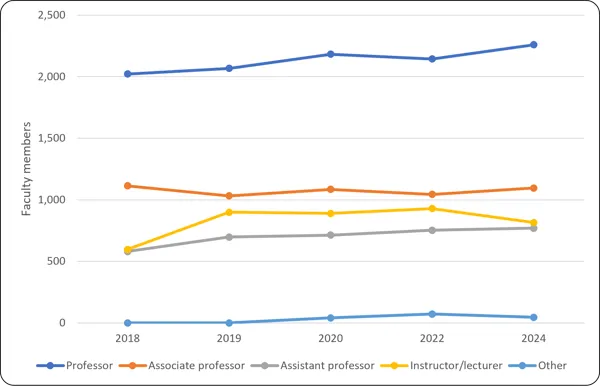
Chart 5.1 - Faculty members by position (2024, full-time equivalent)
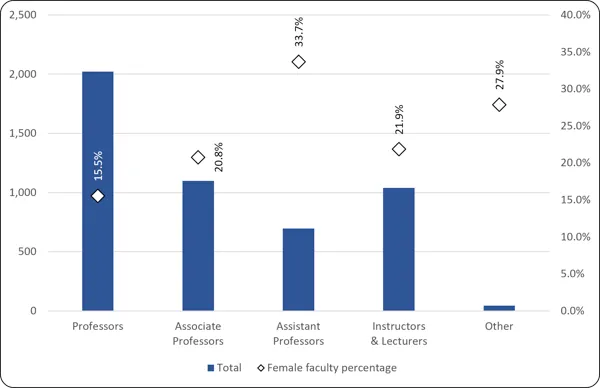
Chart 5.2 - Female-identified faculty members (2024, full-time equivalent)
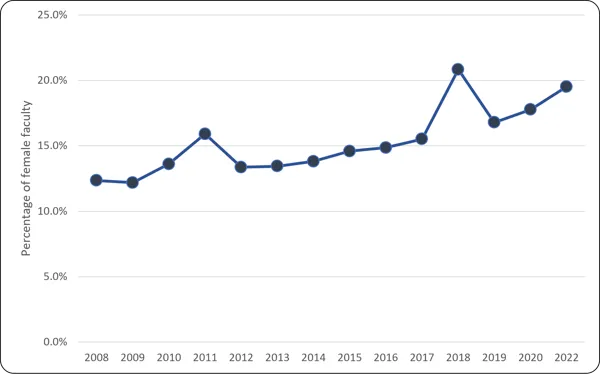
Chart 5.3 - Proportion of female-identified faculty members (2008-2024, full-time equivalent)
Appendix A
Data found in the following tables can be downloaded in Excel format.
Undergraduate Enrolment (U)
Undergraduate Degrees Awarded (UD)
Postgraduate Student Enrolment (G)
Postgraduate Degrees Awarded (GD)
Faculty Members by institution (F)
Co-op, Internship, and Professional Experience Programs (C)